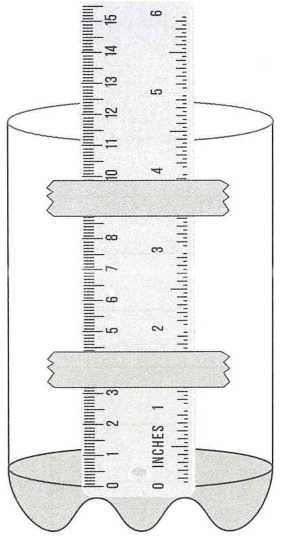
Build a rain gauge using a plastic bottle, short transparent plastic ruler, sticky tape and, optionally, rocks and stones. Ask an adult to help cut the top two-thirds off the bottle with a craft knife or scissors. Tape the ruler outside so the water level is visible against its scale, on a part where the bottle diameter does not change. Place it outside where it can catch rainfall and stabilise it if necessary. Fill it with water to the ruler’s 0 mark. Empty it every day and add water again to the 0 mark.
Check the rain gauge daily for one month. Take note of the amount of rainfall in millimetres it has collected. Record your results in the table. Record of rainfall for the month: ____
| Date | Amount of rainfall in mm | Observations about the weather |
|---|---|---|
| | | |
You measured rainfall daily for one month with a rain gauge, emptying it and refilling to its 0 mark after each daily reading. Use your own table of daily rainfall in millimetres. What was the total amount of rain in mm that fell in your area?
You measured rainfall daily for one month with a rain gauge, emptying it and refilling to its 0 mark after each daily reading. Use your own table of daily rainfall in millimetres. Describe the month in terms of this rainfall pattern. Give a reason for your answer.
Build a rain gauge using a plastic bottle, short transparent plastic ruler, sticky tape and, optionally, rocks and stones. Ask an adult to help cut the top two-thirds off the bottle with a craft knife or scissors. Tape the ruler outside so the water level is visible against its scale, on a part where the bottle diameter does not change. Place it outside where it can catch rainfall and stabilise it if necessary. Fill it with water to the ruler’s 0 mark. Empty it every day and add water again to the 0 mark.
How could you improve your rain gauge? For each suggestion, explain why it would improve your rain gauge.
Materials: pencil with eraser topper, pin, drinking straw (paper or plastic), cardboard, sticky tape, scissors, paper cup, permanent marker. Work in pairs. Design a wind vane that will measure wind direction using the materials provided. The wind vane must swing freely. In the space below, draw a labelled diagram to show what your wind vane looks like.
Build your wind vane based on your design. Fix its support securely, ensure it rotates freely, and align the direction marks. Decide what time of day you are going to check the direction of the wind. Record your observations over the course of a week. Record the wind direction and other weather conditions in the table.
| Date | Wind direction | Observations about other weather conditions (sunny, rainy, cloudy, cold, warm) |
|---|---|---|
| | | |
Using the week of local wind-direction and weather observations you recorded, answer: Does the direction of the wind affect the weather in your location? Write your observations.
If the wind blows in an easterly direction, the weather is mostly ____.
If the wind blows in a westerly direction, the weather is mostly ____.
If the wind blows in a northerly direction, the weather is mostly ____.
If the wind blows in a southerly direction, the weather is mostly ____.
Materials: pencil with eraser topper, pin, drinking straw (paper or plastic), cardboard, sticky tape, scissors, paper cup, permanent marker. You built a wind vane to measure local wind direction. How could you improve your wind vane? For each suggestion, explain why it would improve your wind vane.
Tick (✓) the statement that does not refer to weather.
- It is the state of the atmosphere at a specific place at a given time.
- It is defined by latitude and altitude.
- It can be predicted using tools such as a barometer.
- It is variable.
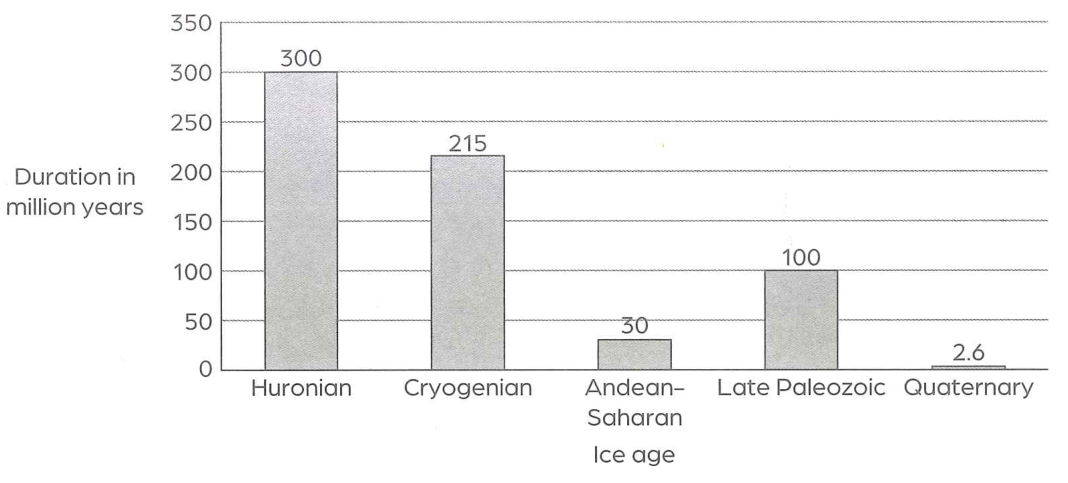
The graph below shows the duration of the major ice ages in the Earth’s history.
Chronology from the Student’s Book: Huronian 2.4–2.1 billion years ago; Cryogenian 850–635 million years ago; Andean–Saharan 460–430 million years ago; Late Paleozoic 360–260 million years ago; Quaternary 2.6 million years ago–present.
Which is the oldest major ice age and how long did it last?