Skip to content / Đến nội dung
SachHeCam.com

Cambridge Secondary (7-9). Stage 7. MCE Science. Workbook - Unit 4: Classifying Living Things

Question 1

Complete the sentence to describe the process of growth in living things.

Growth in living things is the ______ in the size and ______ of cells.

Question 2

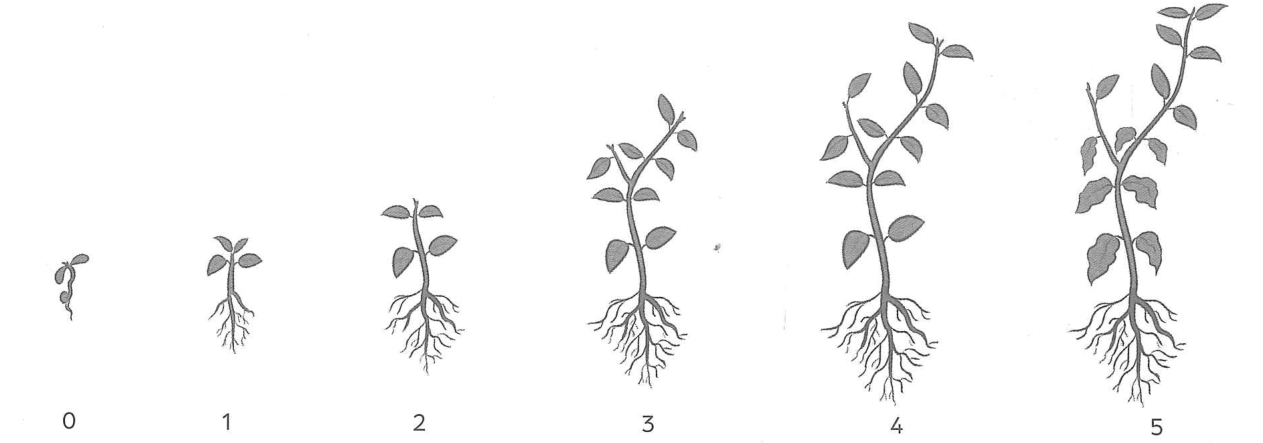
Aziz measured the growth of a bean seedling once a week for five weeks. He drew a picture of the plant each time. Here are his results.

| Week | Height in cm | Number of leaves |
|---|---|---|
| 0 | 1.1 | 2 |
| 1 | 2.0 | 4 |
| 2 | 10.6 | 4 |
| 3 | 21.2 | 9 |
| 4 | 30.4 | 12 |
| 5 | 36.1 | 14 |


What was the initial height of the bean plant when Aziz started taking records?

Question 3

Aziz measured the growth of a bean seedling once a week for five weeks. He drew a picture of the plant each time. Here are his results.

| Week | Height in cm | Number of leaves |
|---|---|---|
| 0 | 1.1 | 2 |
| 1 | 2.0 | 4 |
| 2 | 10.6 | 4 |
| 3 | 21.2 | 9 |
| 4 | 30.4 | 12 |
| 5 | 36.1 | 14 |


Between which two weeks did the plant grow the most in height?

Question 4

Aziz measured the growth of a bean seedling once a week for five weeks. He drew a picture of the plant each time. Here are his results.

| Week | Height in cm | Number of leaves |
|---|---|---|
| 0 | 1.1 | 2 |
| 1 | 2.0 | 4 |
| 2 | 10.6 | 4 |
| 3 | 21.2 | 9 |
| 4 | 30.4 | 12 |
| 5 | 36.1 | 14 |


By how much did the plant grow during the period of greatest growth?

Question 5

Aziz measured the growth of a bean seedling once a week for five weeks. He drew a picture of the plant each time. Here are his results.

| Week | Height in cm | Number of leaves |
|---|---|---|
| 0 | 1.1 | 2 |
| 1 | 2.0 | 4 |
| 2 | 10.6 | 4 |
| 3 | 21.2 | 9 |
| 4 | 30.4 | 12 |
| 5 | 36.1 | 14 |


Between which two weeks did the plant grow the least in height?

Question 6

Aziz measured the growth of a bean seedling once a week for five weeks. He drew a picture of the plant each time. Here are his results.

| Week | Height in cm | Number of leaves |
|---|---|---|
| 0 | 1.1 | 2 |
| 1 | 2.0 | 4 |
| 2 | 10.6 | 4 |
| 3 | 21.2 | 9 |
| 4 | 30.4 | 12 |
| 5 | 36.1 | 14 |


By how much did the plant grow in height over the five weeks of the investigation?

Question 7

Aziz measured the growth of a bean seedling once a week for five weeks. He drew a picture of the plant each time. Here are his results.

| Week | Height in cm | Number of leaves |
|---|---|---|
| 0 | 1.1 | 2 |
| 1 | 2.0 | 4 |
| 2 | 10.6 | 4 |
| 3 | 21.2 | 9 |
| 4 | 30.4 | 12 |
| 5 | 36.1 | 14 |


What was the average growth in height per week?

Question 8

Aziz measured the growth of a bean seedling once a week for five weeks. He drew a picture of the plant each time. Here are his results.

| Week | Height in cm | Number of leaves |
|---|---|---|
| 0 | 1.1 | 2 |
| 1 | 2.0 | 4 |
| 2 | 10.6 | 4 |
| 3 | 21.2 | 9 |
| 4 | 30.4 | 12 |
| 5 | 36.1 | 14 |


Between which two weeks did the plant grow the most new leaves?

Question 9

Aziz measured the growth of a bean seedling once a week for five weeks. He drew a picture of the plant each time. Here are his results.

| Week | Height in cm | Number of leaves |
|---|---|---|
| 0 | 1.1 | 2 |
| 1 | 2.0 | 4 |
| 2 | 10.6 | 4 |
| 3 | 21.2 | 9 |
| 4 | 30.4 | 12 |
| 5 | 36.1 | 14 |


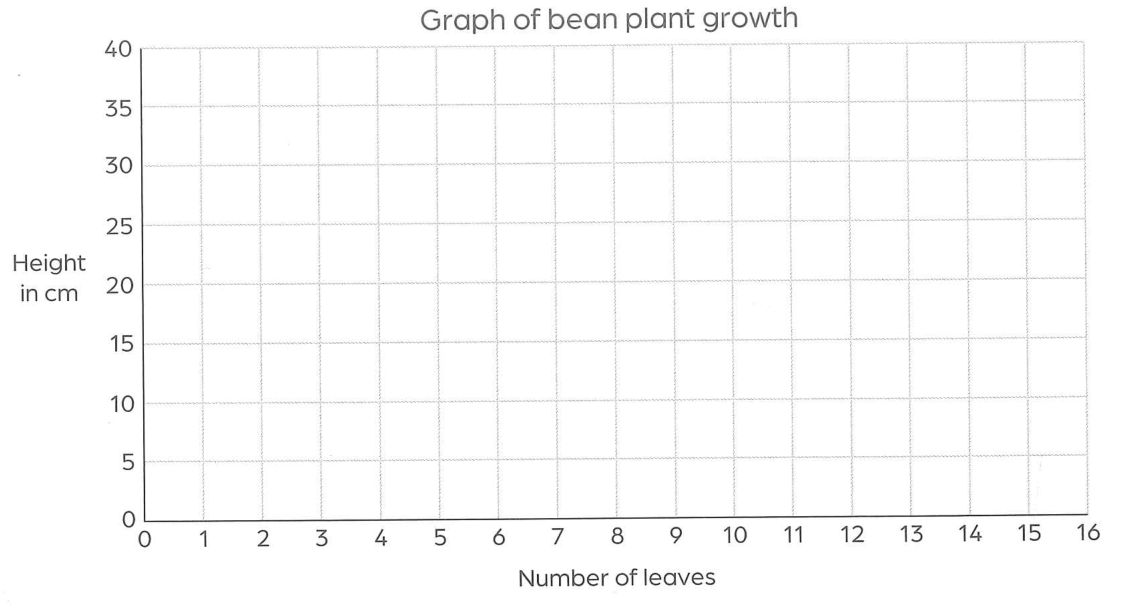
We use scatter graphs to look for a relationship (link) between two variables. Using the data provided, make a scatter graph to show the relationship between height and number of leaves for the plant.

Question illustration

Question 10

Aziz measured the growth of a bean seedling once a week for five weeks. He drew a picture of the plant each time. Here are his results.

| Week | Height in cm | Number of leaves |
|---|---|---|
| 0 | 1.1 | 2 |
| 1 | 2.0 | 4 |
| 2 | 10.6 | 4 |
| 3 | 21.2 | 9 |
| 4 | 30.4 | 12 |
| 5 | 36.1 | 14 |


Analyse the scatter graph and answer the following question. What relationship can you see between the height of the plant and the number of leaves?

Question 11

Aziz measured the growth of a bean seedling once a week for five weeks. He drew a picture of the plant each time. Here are his results.

| Week | Height in cm | Number of leaves |
|---|---|---|
| 0 | 1.1 | 2 |
| 1 | 2.0 | 4 |
| 2 | 10.6 | 4 |
| 3 | 21.2 | 9 |
| 4 | 30.4 | 12 |
| 5 | 36.1 | 14 |


Are there any data points that do not fit the pattern? Suggest a reason for this.

Question illustration

Question 12

Aziz measured the growth of a bean seedling once a week for five weeks. He drew a picture of the plant each time. Here are his results.

| Week | Height in cm | Number of leaves |
|---|---|---|
| 0 | 1.1 | 2 |
| 1 | 2.0 | 4 |
| 2 | 10.6 | 4 |
| 3 | 21.2 | 9 |
| 4 | 30.4 | 12 |
| 5 | 36.1 | 14 |


Suggest another measurement you could take to record growth in plants.

Question 13

Aziz measured the growth of a bean seedling once a week for five weeks. He drew a picture of the plant each time. Here are his results.

| Week | Height in cm | Number of leaves |
|---|---|---|
| 0 | 1.1 | 2 |
| 1 | 2.0 | 4 |
| 2 | 10.6 | 4 |
| 3 | 21.2 | 9 |
| 4 | 30.4 | 12 |
| 5 | 36.1 | 14 |


What are some limitations in the data obtained?

Question 14

Aziz measured the growth of a bean seedling once a week for five weeks. He drew a picture of the plant each time. Here are his results.

| Week | Height in cm | Number of leaves |
|---|---|---|
| 0 | 1.1 | 2 |
| 1 | 2.0 | 4 |
| 2 | 10.6 | 4 |
| 3 | 21.2 | 9 |
| 4 | 30.4 | 12 |
| 5 | 36.1 | 14 |


Suppose you want to use the data to predict the growth of other bean plants. Suggest one way the investigation could be improved.

Question 15

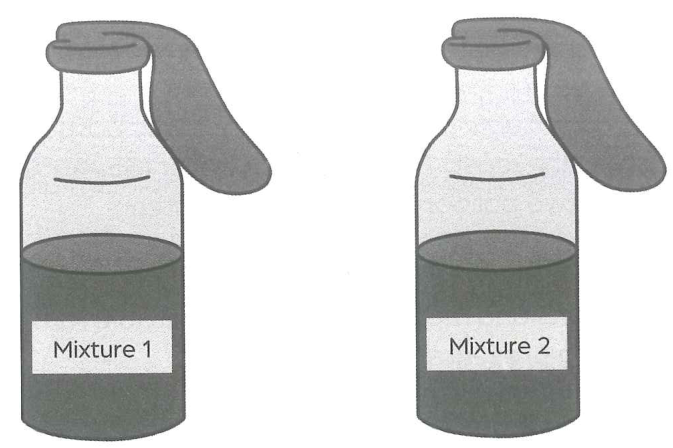
Work in groups. Wear eye protection and gloves; handle yeast carefully and avoid contact with eyes, skin and clothing. Mix 5 g of active dry yeast with 30 cm³ of warm water (35–40 °C). Label two clear plastic bottles mixture 1 and mixture 2. Mixture 1: 100 cm³ water + 15 cm³ yeast mixture. Mixture 2: 10 g sugar + 100 cm³ water + 15 cm³ yeast mixture. Cap and shake each bottle, then remove the caps and fit a balloon over each opening (stretch its opening if needed). Start a timer. Yeast is unicellular and releases carbon dioxide during respiration. Respiration releases energy; it is not breathing.

Question illustration

Start the timer or stopwatch. What do you observe after 10 minutes?

Question 16

Work in groups. Wear eye protection and gloves; handle yeast carefully and avoid contact with eyes, skin and clothing. Mix 5 g of active dry yeast with 30 cm³ of warm water (35–40 °C). Label two clear plastic bottles mixture 1 and mixture 2. Mixture 1: 100 cm³ water + 15 cm³ yeast mixture. Mixture 2: 10 g sugar + 100 cm³ water + 15 cm³ yeast mixture. Cap and shake each bottle, then remove the caps and fit a balloon over each opening (stretch its opening if needed). Start a timer. Yeast is unicellular and releases carbon dioxide during respiration. Respiration releases energy; it is not breathing.

Question illustration

Observe the solutions every 5 minutes for the next 20 minutes. Notice whether the balloons are inflating more or not. Record your observations from step 7 in the table below.

| Time in min | Inflation of balloon: Mixture 1 | Inflation of balloon: Mixture 2 |
|---|---|---|
|10| | |
|15| | |
|20| | |
|25| | |
|30| | |

Question 17

Work in groups. Wear eye protection and gloves; handle yeast carefully and avoid contact with eyes, skin and clothing. Mix 5 g of active dry yeast with 30 cm³ of warm water (35–40 °C). Label two clear plastic bottles mixture 1 and mixture 2. Mixture 1: 100 cm³ water + 15 cm³ yeast mixture. Mixture 2: 10 g sugar + 100 cm³ water + 15 cm³ yeast mixture. Cap and shake each bottle, then remove the caps and fit a balloon over each opening (stretch its opening if needed). Start a timer. Yeast is unicellular and releases carbon dioxide during respiration. Respiration releases energy; it is not breathing.

Question illustration

What is the purpose of the sugar solution?

Question 18

Work in groups. Wear eye protection and gloves; handle yeast carefully and avoid contact with eyes, skin and clothing. Mix 5 g of active dry yeast with 30 cm³ of warm water (35–40 °C). Label two clear plastic bottles mixture 1 and mixture 2. Mixture 1: 100 cm³ water + 15 cm³ yeast mixture. Mixture 2: 10 g sugar + 100 cm³ water + 15 cm³ yeast mixture. Cap and shake each bottle, then remove the caps and fit a balloon over each opening (stretch its opening if needed). Start a timer. Yeast is unicellular and releases carbon dioxide during respiration. Respiration releases energy; it is not breathing.

Question illustration

Which of the balloons inflated?

Question 19

Work in groups. Wear eye protection and gloves; handle yeast carefully and avoid contact with eyes, skin and clothing. Mix 5 g of active dry yeast with 30 cm³ of warm water (35–40 °C). Label two clear plastic bottles mixture 1 and mixture 2. Mixture 1: 100 cm³ water + 15 cm³ yeast mixture. Mixture 2: 10 g sugar + 100 cm³ water + 15 cm³ yeast mixture. Cap and shake each bottle, then remove the caps and fit a balloon over each opening (stretch its opening if needed). Start a timer. Yeast is unicellular and releases carbon dioxide during respiration. Respiration releases energy; it is not breathing.

Question illustration

Why did that balloon inflate?

Question 20

Work in groups. Wear eye protection and gloves; handle yeast carefully and avoid contact with eyes, skin and clothing. Mix 5 g of active dry yeast with 30 cm³ of warm water (35–40 °C). Label two clear plastic bottles mixture 1 and mixture 2. Mixture 1: 100 cm³ water + 15 cm³ yeast mixture. Mixture 2: 10 g sugar + 100 cm³ water + 15 cm³ yeast mixture. Cap and shake each bottle, then remove the caps and fit a balloon over each opening (stretch its opening if needed). Start a timer. Yeast is unicellular and releases carbon dioxide during respiration. Respiration releases energy; it is not breathing.

Question illustration

What result did you observe with mixture 1? Did you expect this result? Say why or why not.
0
0
GIỎ HÀNG
Empty CartGIỎ CHƯA CÓ GÌQUAY LẠI SHOP