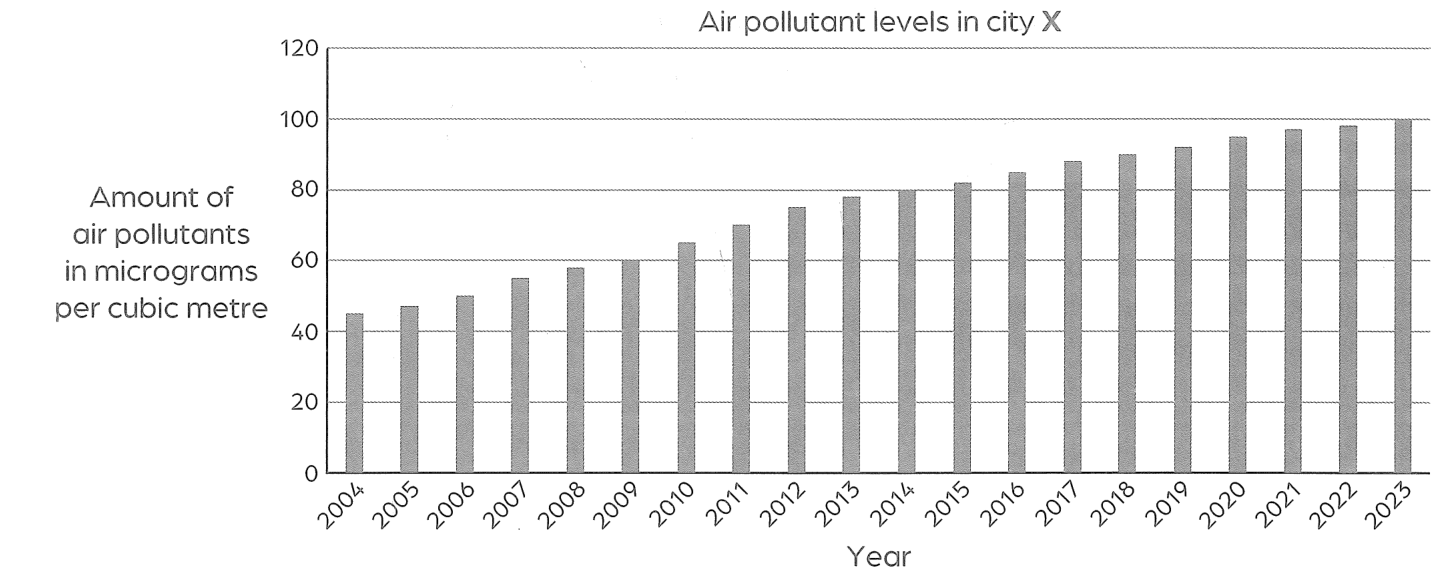
Question 68The graph shows the air pollutant levels in city X measured over a period of 20 years. State two examples of air pollutants.