Question 9
Aziz measured the growth of a bean seedling once a week for five weeks. He drew a picture of the plant each time. Here are his results.
| Week | Height in cm | Number of leaves |
|---|---|---|
| 0 | 1.1 | 2 |
| 1 | 2.0 | 4 |
| 2 | 10.6 | 4 |
| 3 | 21.2 | 9 |
| 4 | 30.4 | 12 |
| 5 | 36.1 | 14 |
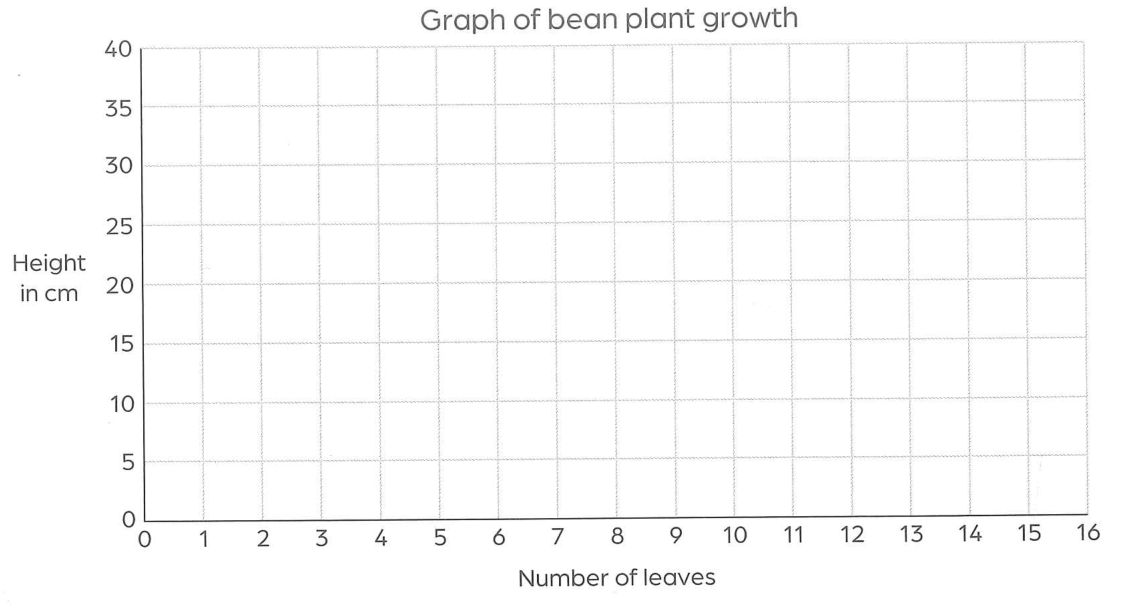
We use scatter graphs to look for a relationship (link) between two variables. Using the data provided, make a scatter graph to show the relationship between height and number of leaves for the plant.
| Week | Height in cm | Number of leaves |
|---|---|---|
| 0 | 1.1 | 2 |
| 1 | 2.0 | 4 |
| 2 | 10.6 | 4 |
| 3 | 21.2 | 9 |
| 4 | 30.4 | 12 |
| 5 | 36.1 | 14 |
We use scatter graphs to look for a relationship (link) between two variables. Using the data provided, make a scatter graph to show the relationship between height and number of leaves for the plant.
