Question 32
Look at the two waveform graphs, A and B, in Figure 11.28.
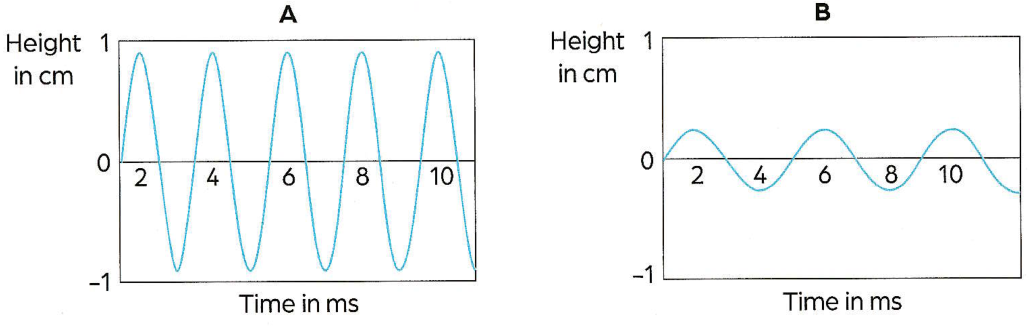
Which graph shows a sound that is softer and has a lower pitch? Explain why.
Which graph shows a sound that is softer and has a lower pitch? Explain why.
Cambridge Secondary (7-9) · Unit 11: Sound
