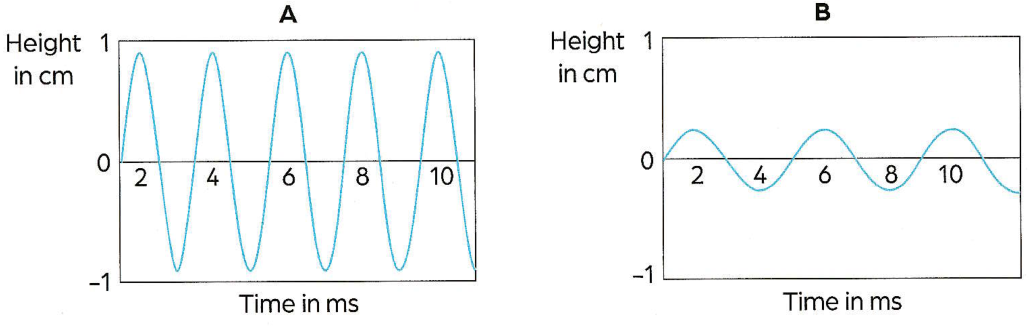
Question 31Look at the two waveform graphs, A and B, in Figure 11.28. Which graph shows a lower frequency?