Question 23
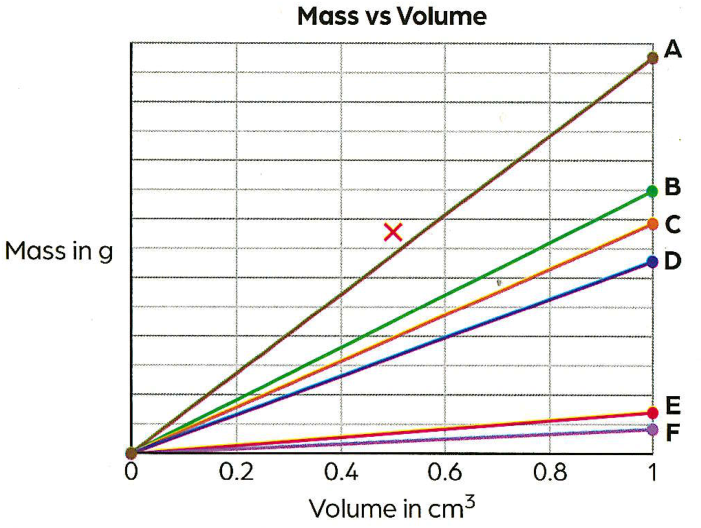
Gayathrie was presented with graphs of mass against volume for six substances, A to F (Figure 9.15). She was asked to sort the substances into three solids and three liquids based on the graphs. The values for mass are not provided, so Gayathrie could not identify the substances by calculating the density from the graphs. Work in pairs to answer the questions.
Gayathrie was given 0.5 cm³ of substance A to measure its density. She measured the mass of the sample and plotted the point X on the graph. Was she correct that A is an anomaly? What conclusion can she make about A?
Gayathrie was given 0.5 cm³ of substance A to measure its density. She measured the mass of the sample and plotted the point X on the graph. Was she correct that A is an anomaly? What conclusion can she make about A?
