Question 71
Look at the two distance–time graphs of a car at different parts of its journey.
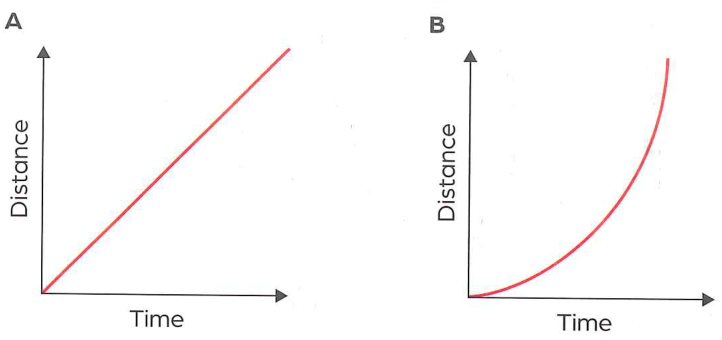
Which of the two graphs represents constant speed?
Which of the two graphs represents constant speed?
Cambridge Secondary (7-9) · Unit 8: Forces and Motion
