Question 32
Work in pairs. Study Figure 1.8 and answer these questions. Huan records his times for a 100 m sprint race.
Which was easiest to read: the table, line graph or bar chart? Explain your answer.
| Race | 1 | 2 | 3 | 4 | 5 | 6 |
|---|---|---|---|---|---|---|
| Time in seconds (s) | 21 | 20 | 18 | 16 | 16 | 15 |
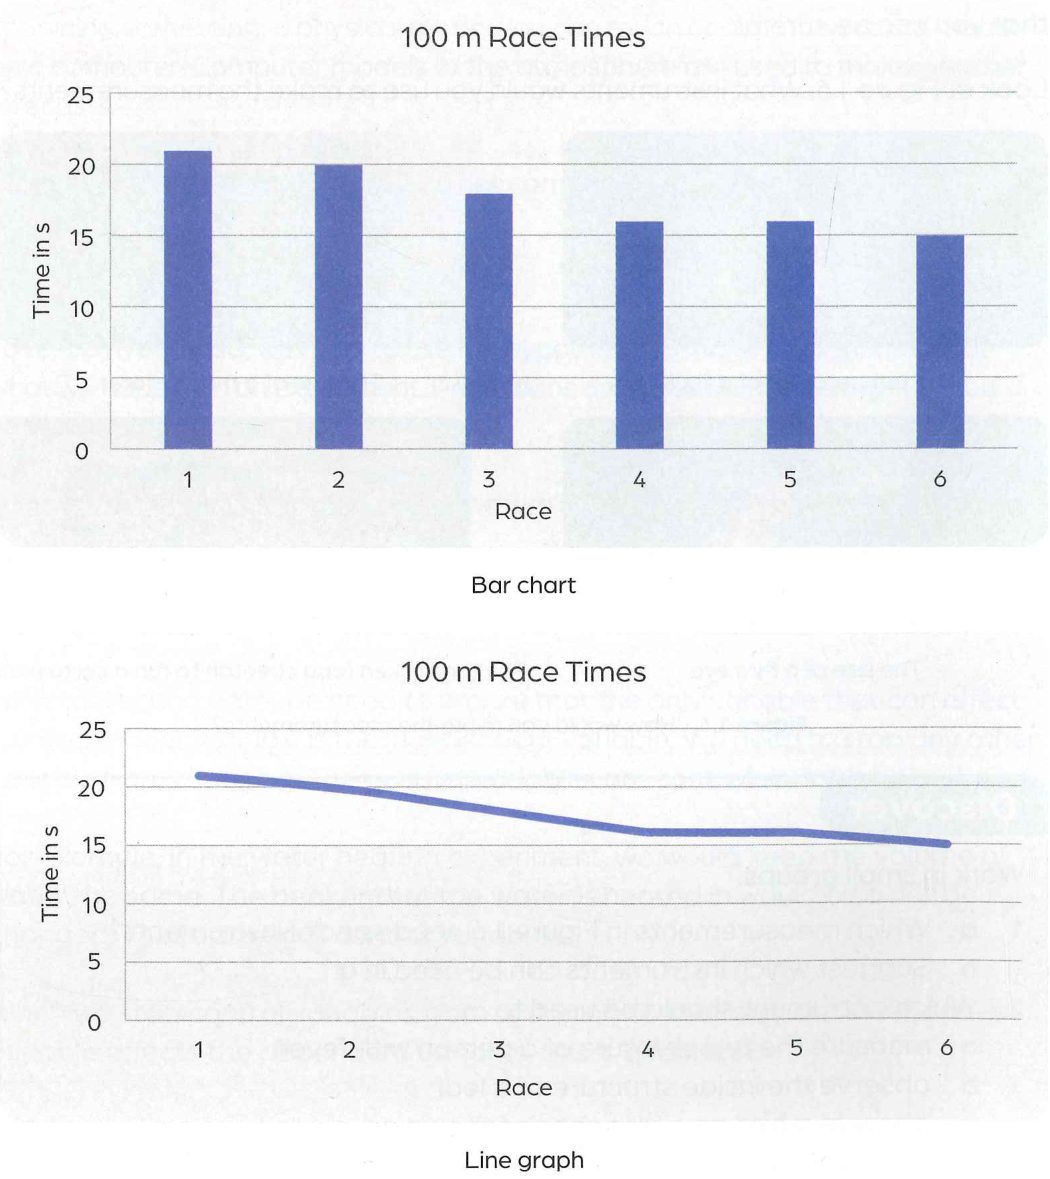
Which was easiest to read: the table, line graph or bar chart? Explain your answer.
| Race | 1 | 2 | 3 | 4 | 5 | 6 |
|---|---|---|---|---|---|---|
| Time in seconds (s) | 21 | 20 | 18 | 16 | 16 | 15 |
