Question 78
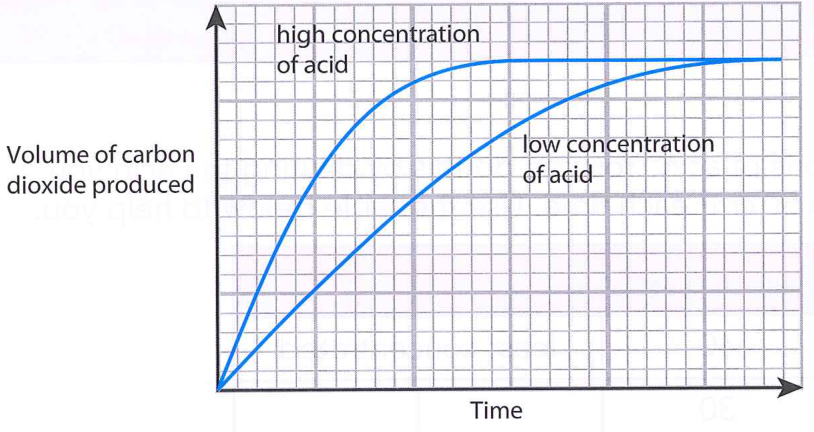
The graph shows typical CO₂ volume against time for equal marble samples reacting with high- and low-concentration hydrochloric acid. Both curves reach the same final gas volume. If you did the same experiment with an even less concentrated acid, what would the line on the graph be like?