Question 70
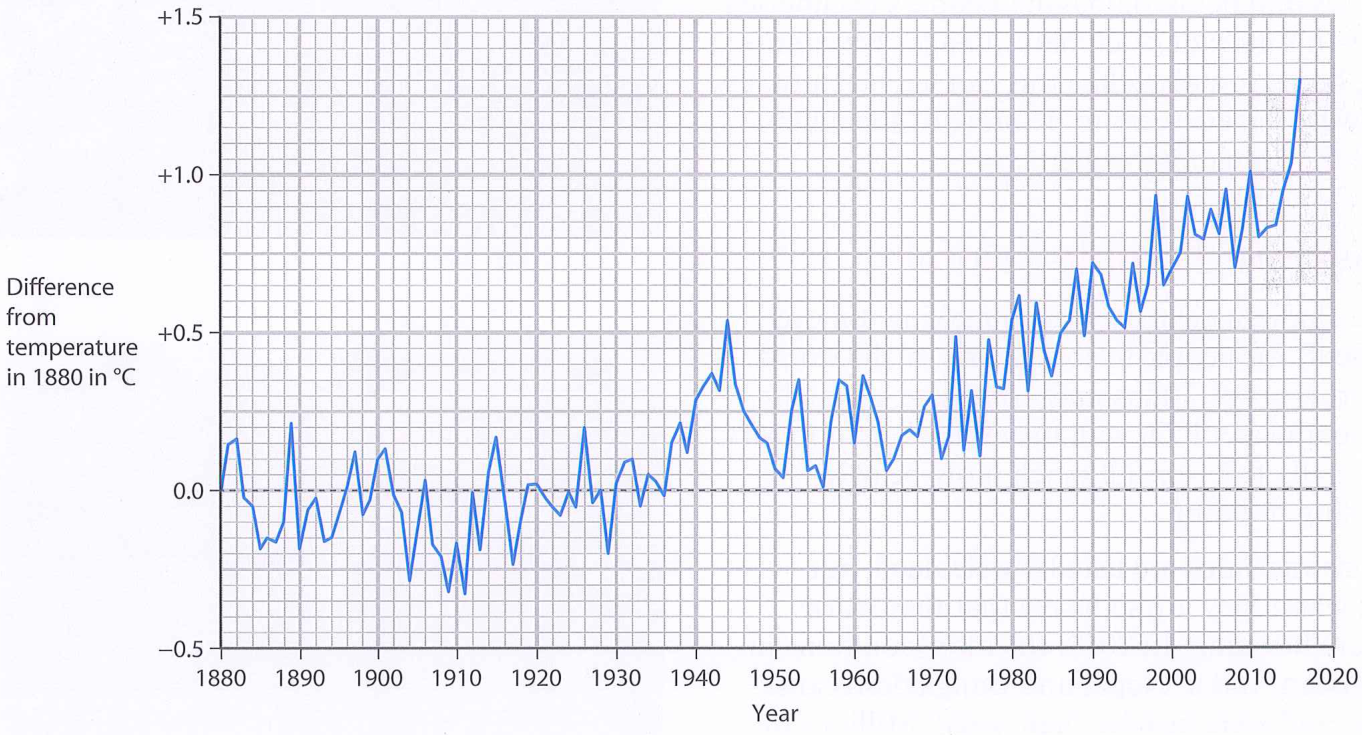
The graph shows how the Earth's mean temperature changed between 1880 and 2016. The y-axis shows the difference from the temperature in 1880, in °C.
Describe the trend shown by the graph between 1910 and 2016.
Describe the trend shown by the graph between 1910 and 2016.
