Question 68
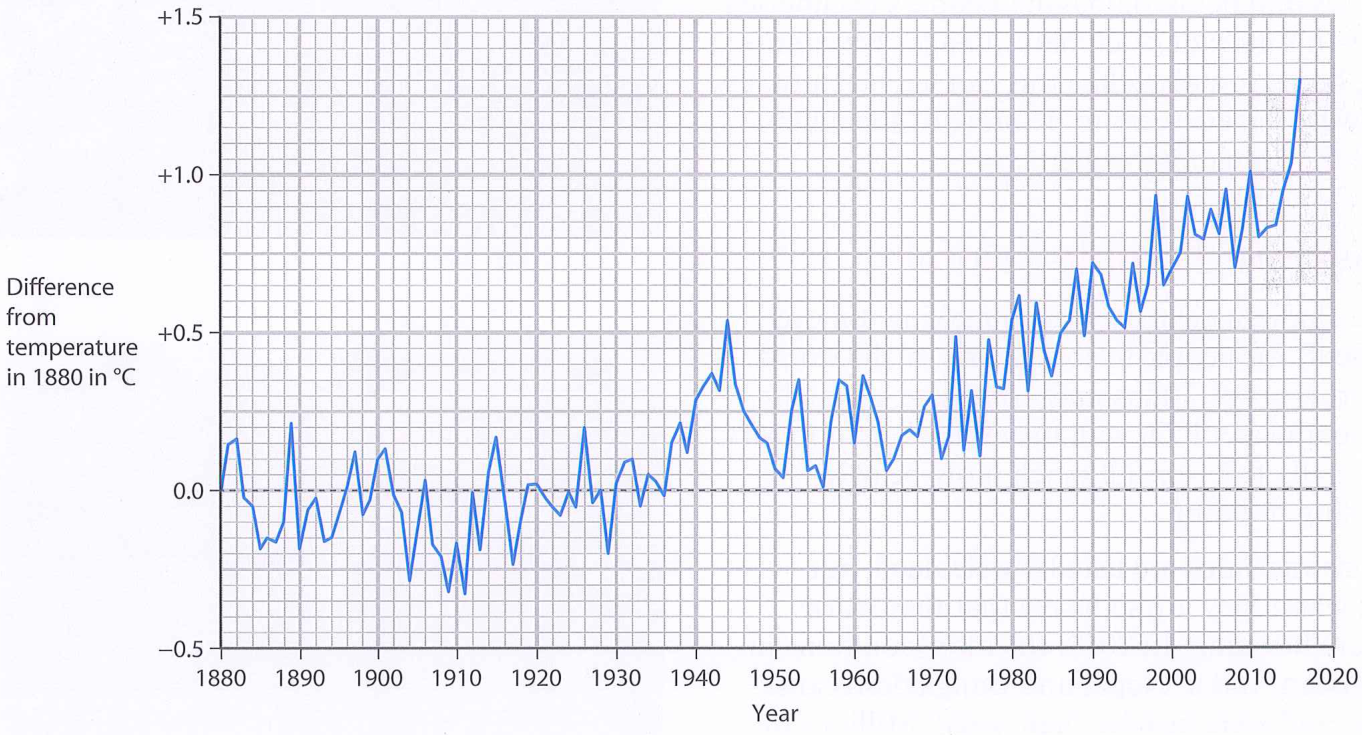
The graph shows how the Earth's mean temperature changed between 1880 and 2016. The y-axis shows the difference from the temperature in 1880, in °C.
Look at the graph. How much higher was the mean temperature in 2016 than in 1880?
Look at the graph. How much higher was the mean temperature in 2016 than in 1880?
