Question 75
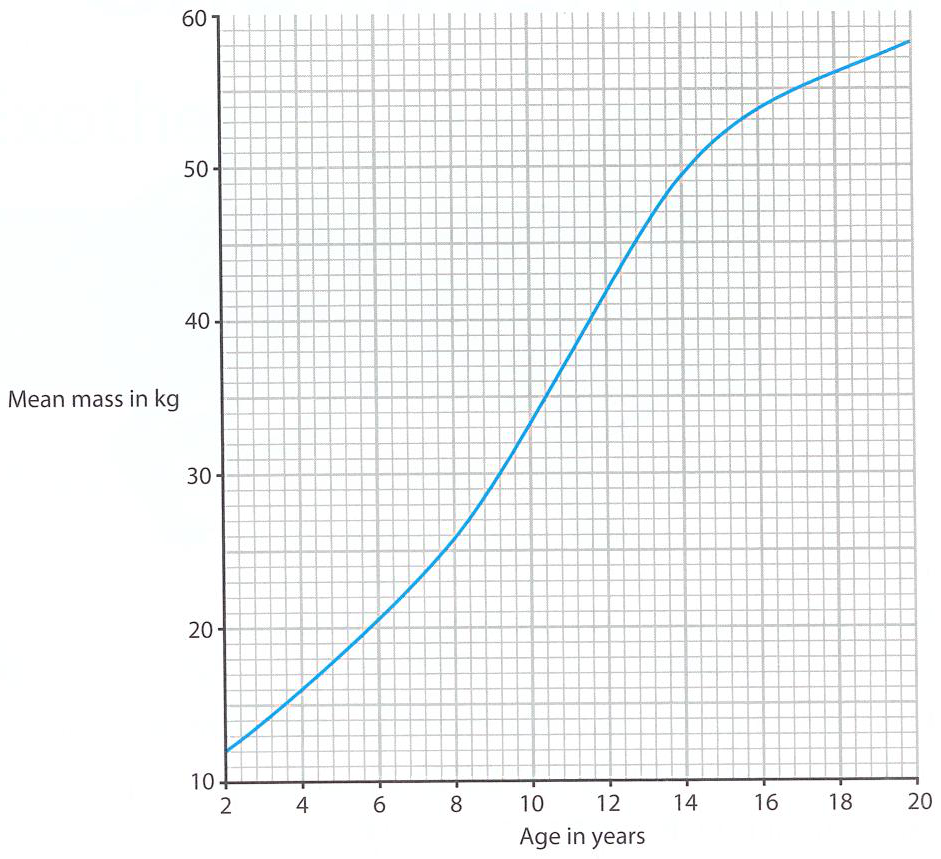
The graph shows the mean mass of girls at different ages.
Does the graph show that most girls have stopped growing by the age of 20? Explain your answer.
Does the graph show that most girls have stopped growing by the age of 20? Explain your answer.
