Question 16
Naomi makes a tally chart to show the colours of cars parked on a street.
| Colour | Tally |
|---|---|
| Black | ~~IIII~~ I |
| Blue | IIII |
| Red | III |
| Silver | ~~IIII~~ II |
| White | ~~IIII~~ ~~IIII~~ |
(~~IIII~~ means a group of 5.)
Naomi makes this bar chart to show the data.
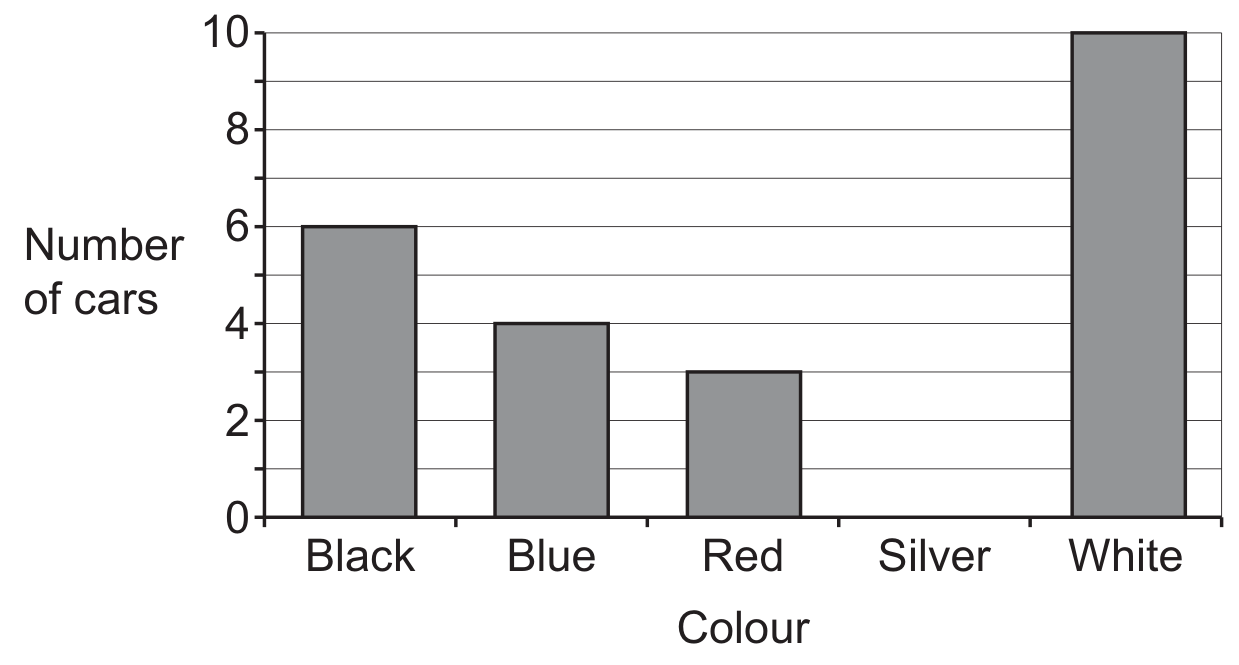
**(a)** Draw the missing bar.
Use a ruler.
| Colour | Tally |
|---|---|
| Black | ~~IIII~~ I |
| Blue | IIII |
| Red | III |
| Silver | ~~IIII~~ II |
| White | ~~IIII~~ ~~IIII~~ |
(~~IIII~~ means a group of 5.)
Naomi makes this bar chart to show the data.
**(a)** Draw the missing bar.
Use a ruler.
