Unit 9: Statistics (2)
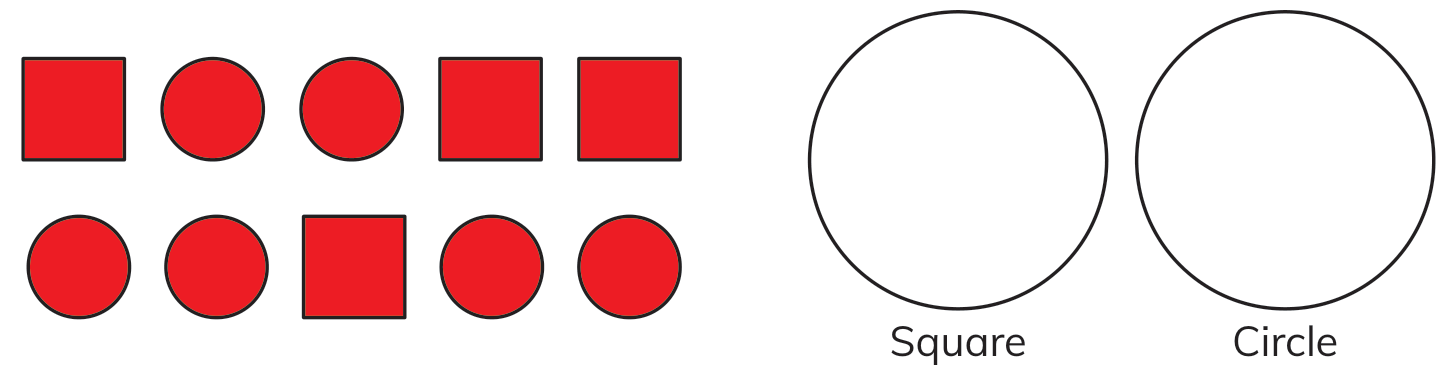
You have 4 squares and 6 circles. Sort and sketch the shapes into the correct circles.
You have 5 squares and 7 triangles. Sort and sketch them into the correct circles.
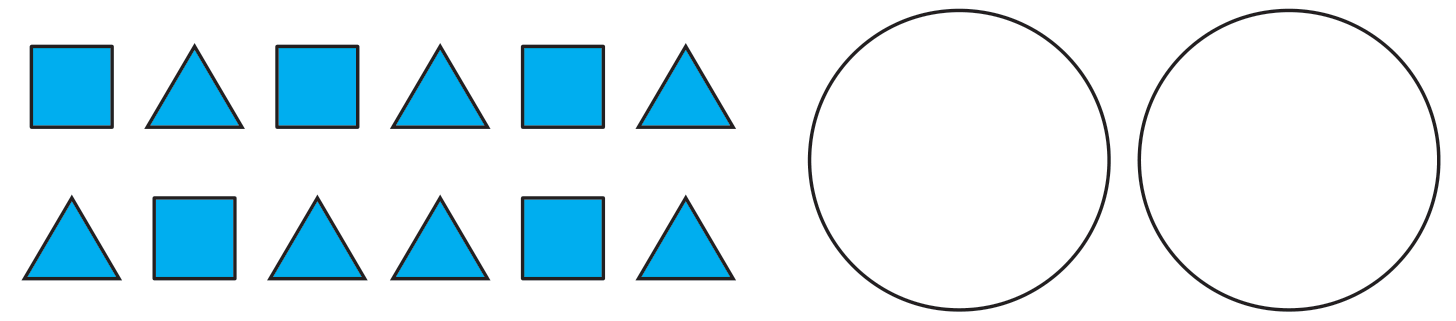
Label your circles.
Look at the shapes you sorted in questions 1 and 2 (count the shapes in all 4 circles).
Question 1: 4 squares and 6 circles. Question 2: 5 squares and 7 triangles.
How many shapes are there altogether in questions 1 and 2?
Look at the shapes you sorted in questions 1 and 2 (count the shapes in all 4 circles).
Question 1: 4 squares and 6 circles. Question 2: 5 squares and 7 triangles.
Which shapes are there more of?
squares
circles
triangles
Look at the shapes you sorted in questions 1 and 2 (count the shapes in all 4 circles).
Question 1: 4 squares and 6 circles. Question 2: 5 squares and 7 triangles.
Which shapes are there fewer of?
squares
circles
triangles
Look at the shapes you sorted in questions 1 and 2 (count the shapes in all 4 circles).
Question 1: 4 squares and 6 circles. Question 2: 5 squares and 7 triangles.
What is the difference between the number of most shapes and the number of fewest shapes?
Look at this Venn diagram.
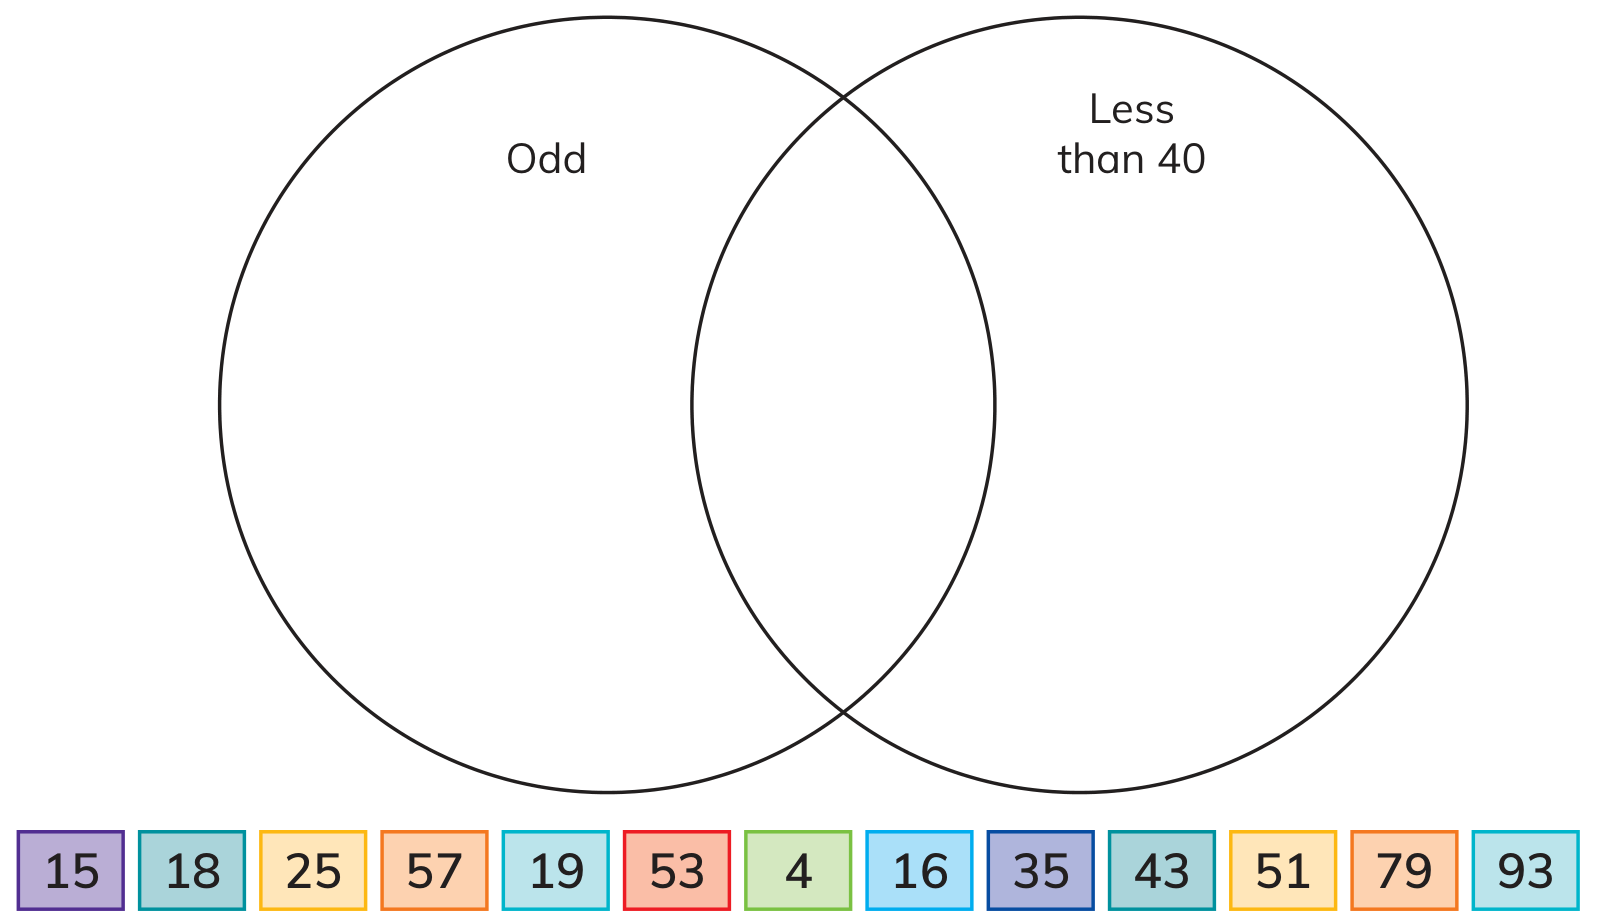
The numbers are: 15, 18, 25, 57, 19, 53, 4, 16, 35, 43, 51, 79, 93.
a) Write a list of the odd numbers.
b) Write a list of the numbers that are less than 40.
c) Write a list of the numbers that would go in the middle of the Venn diagram.
d) Now write your numbers in the Venn diagram above.
These children are playing a game.
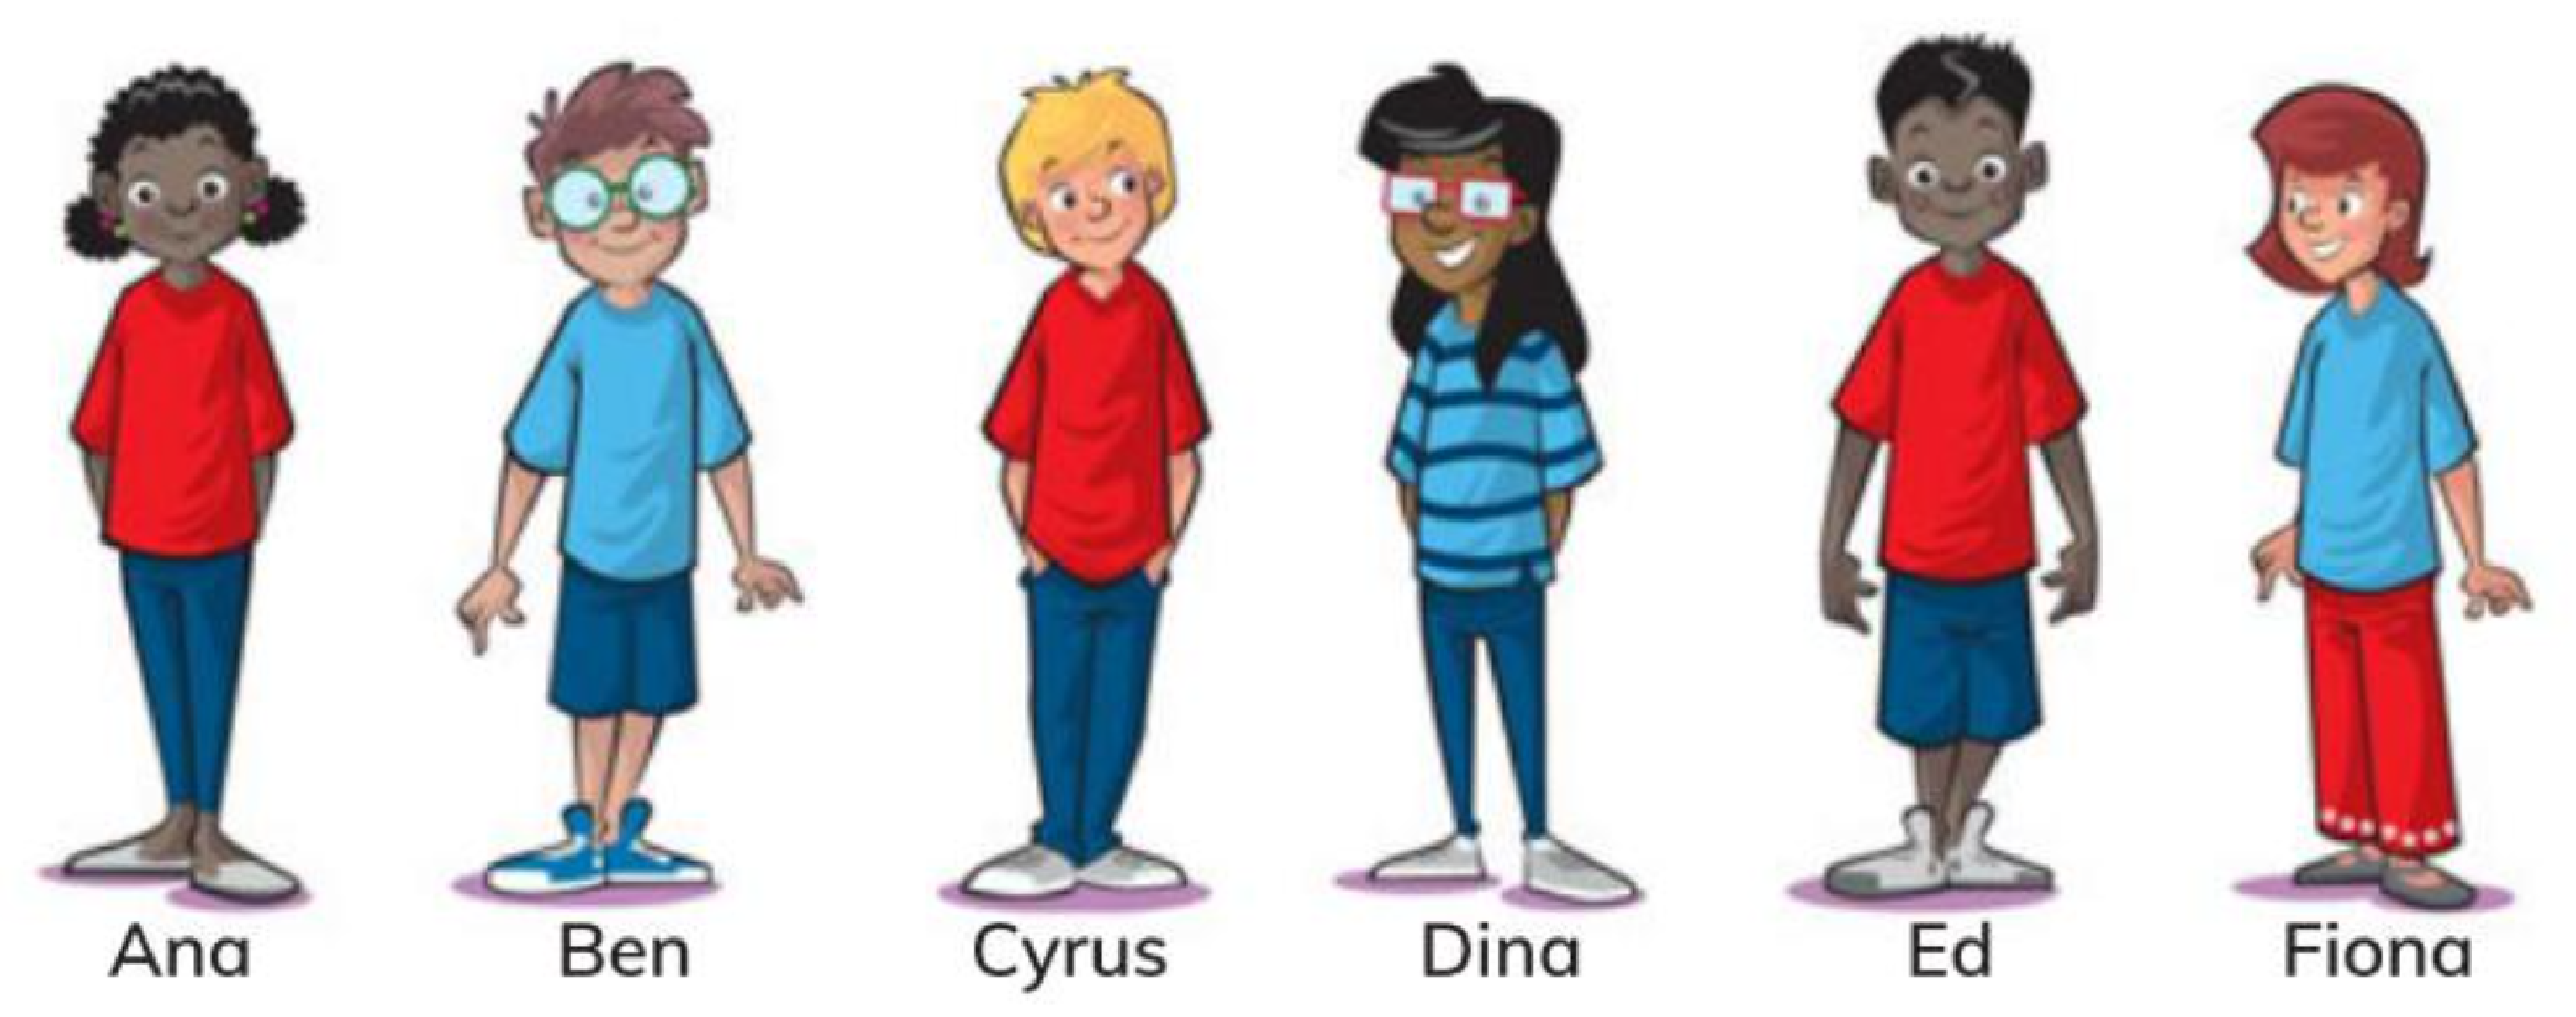
They are using large circles on the floor to put themselves into as many different groups as they can.
Find 3 different ways of sorting them. Write the names into the Venn diagrams.
Don't forget to write the labels.
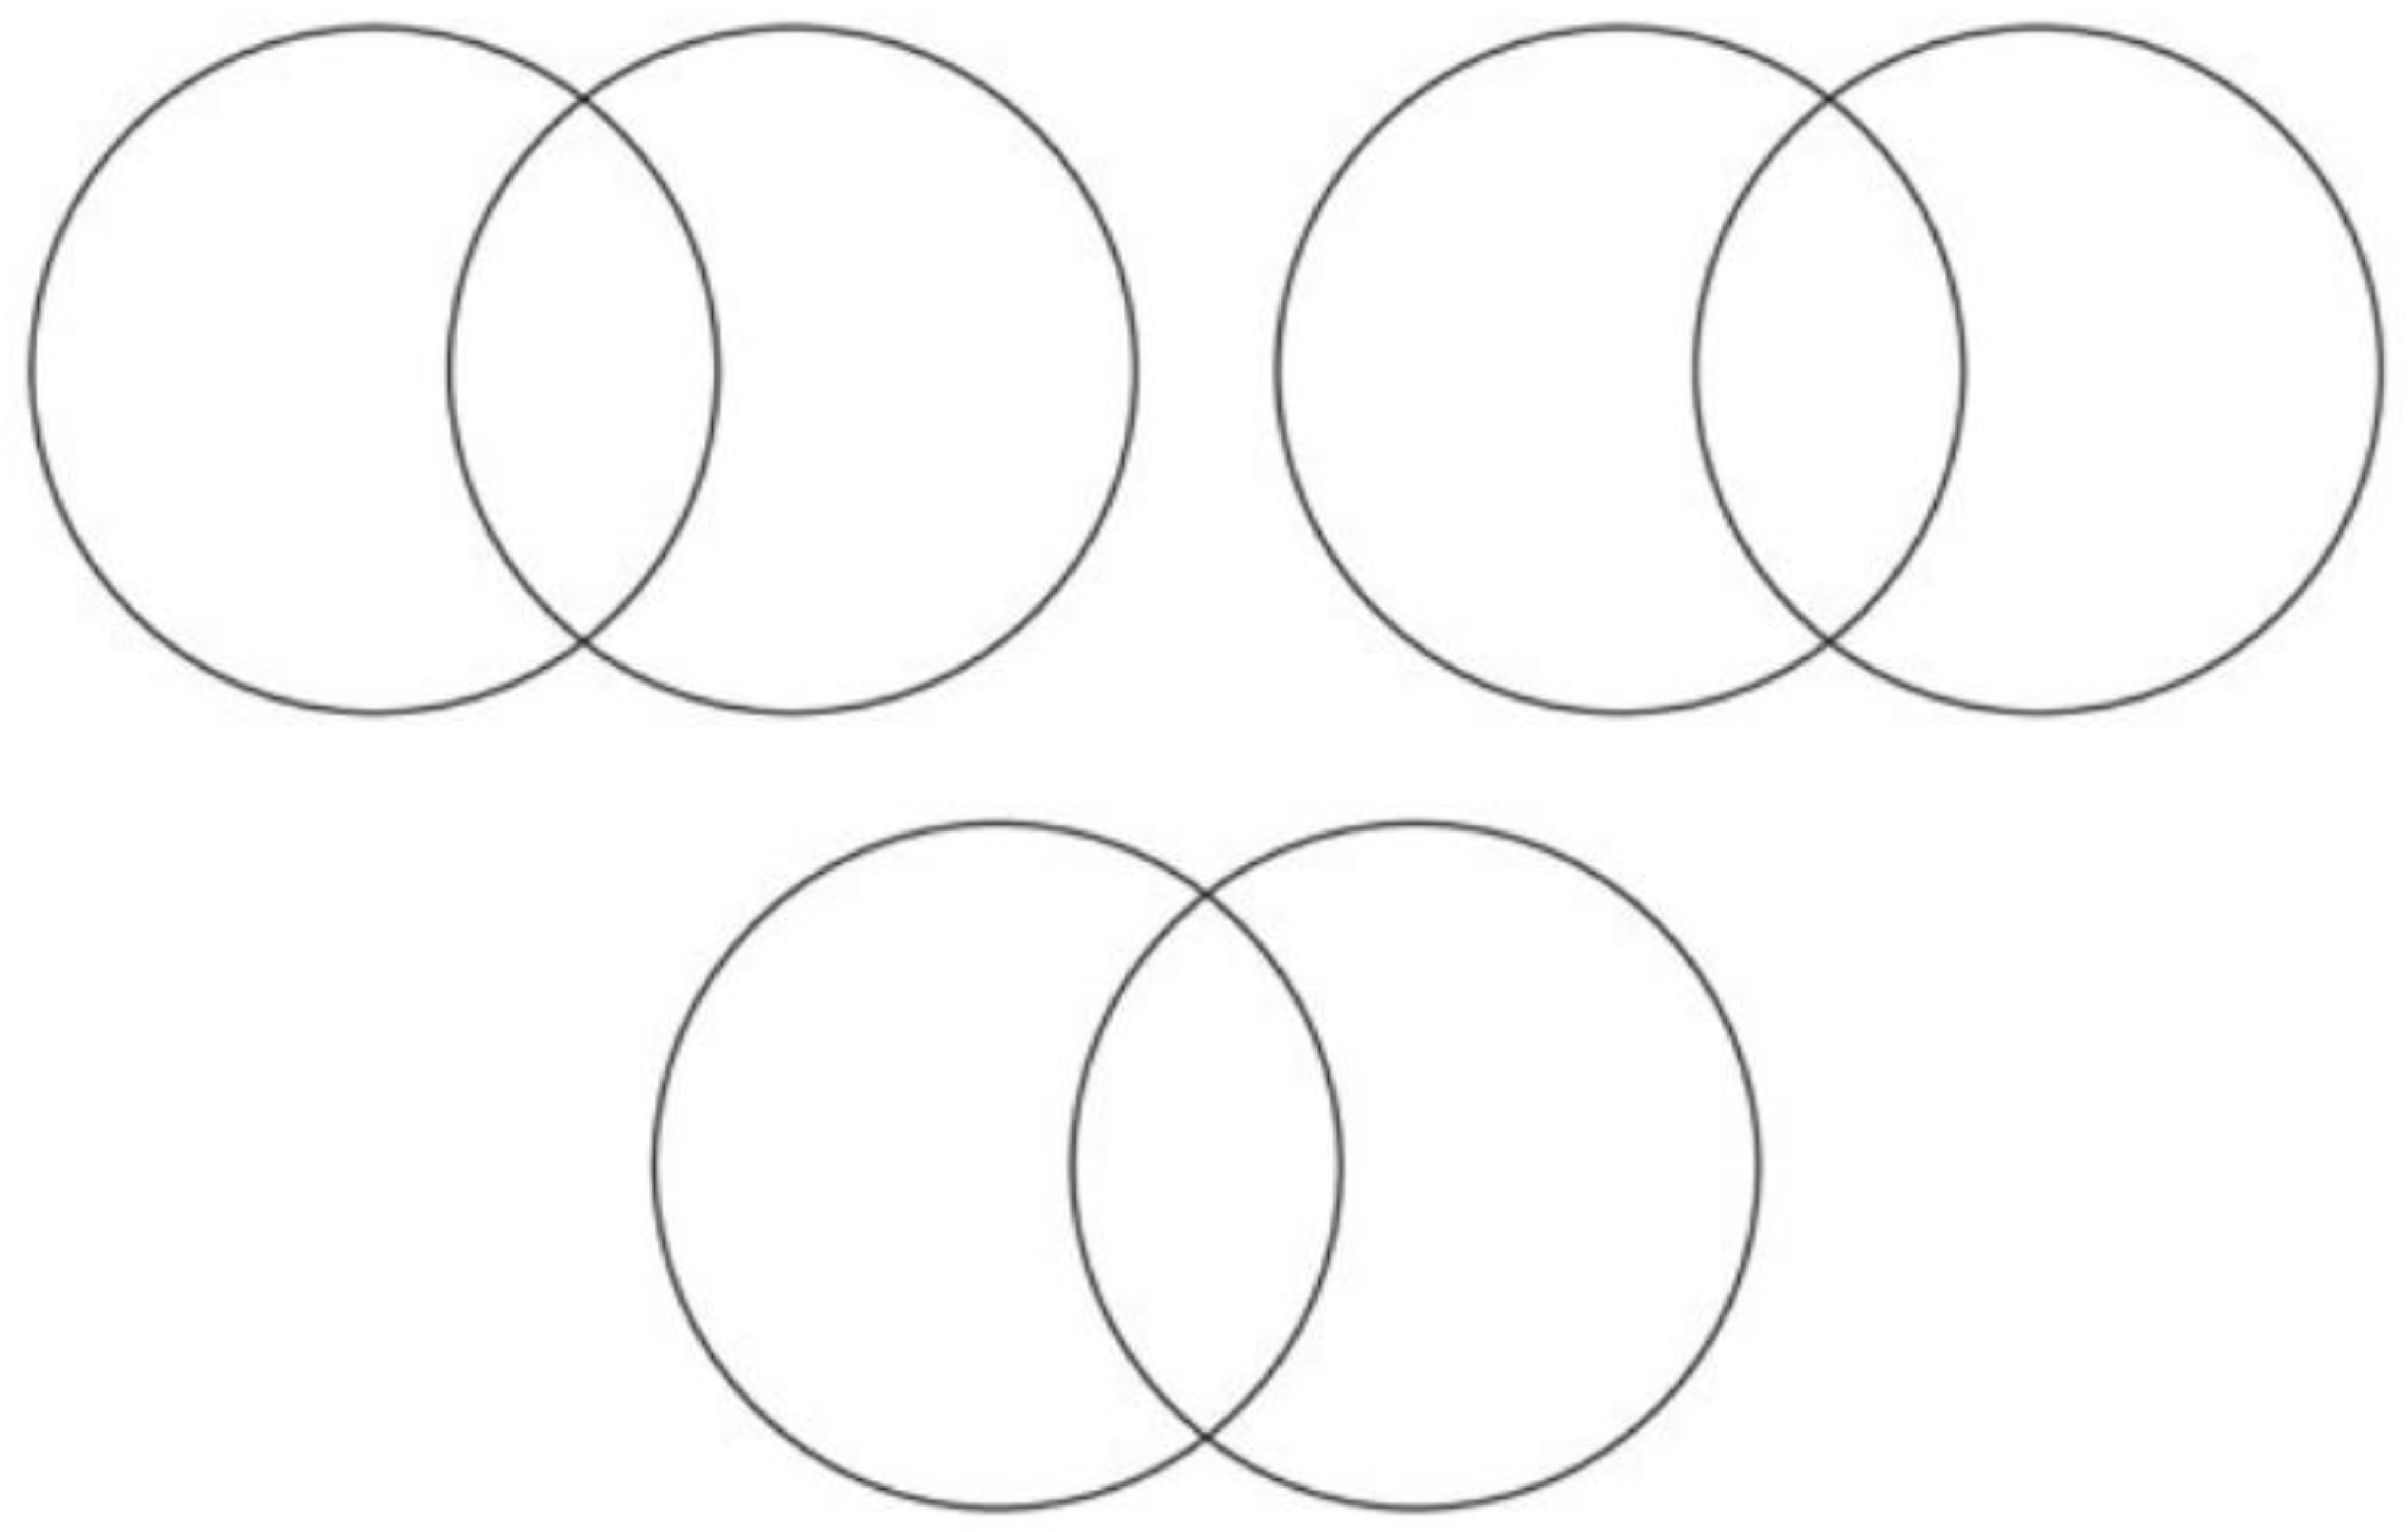
Describe what you did. Write 3 things the data tells you.
Work with a partner.
Write the names of these children in the correct places in the Venn diagrams.

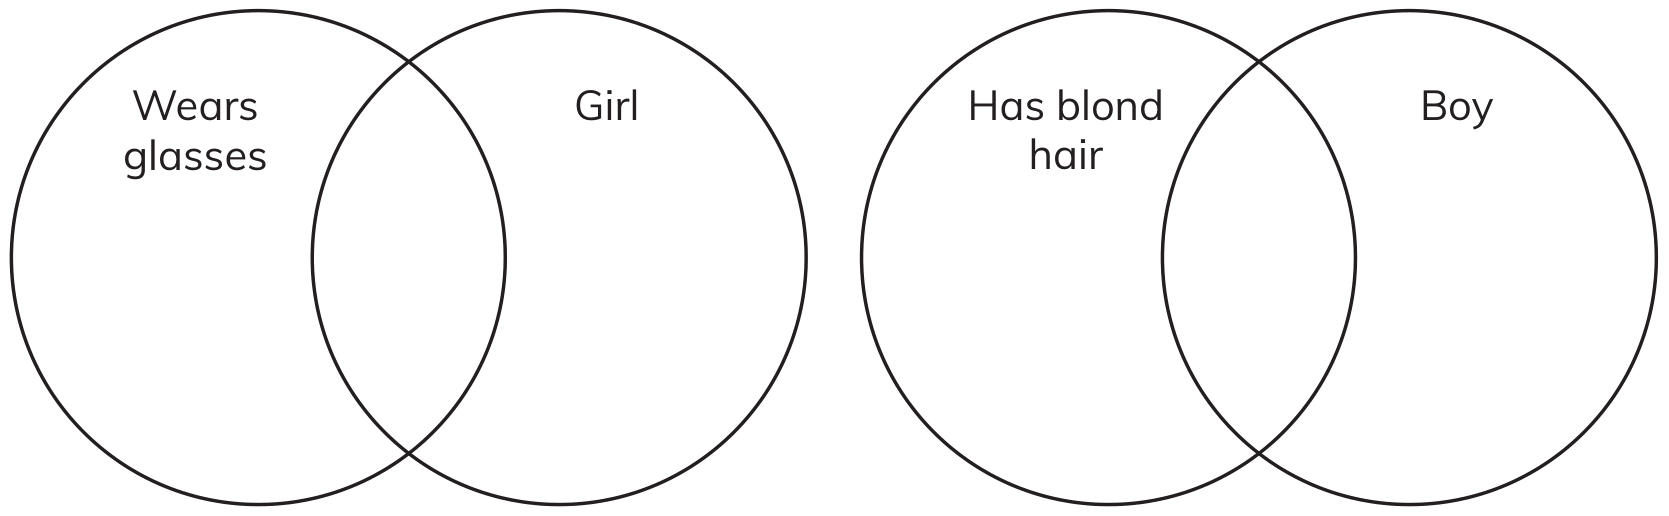
Write 2 things that you have found out.
Shapes are sorted into 2 sets.
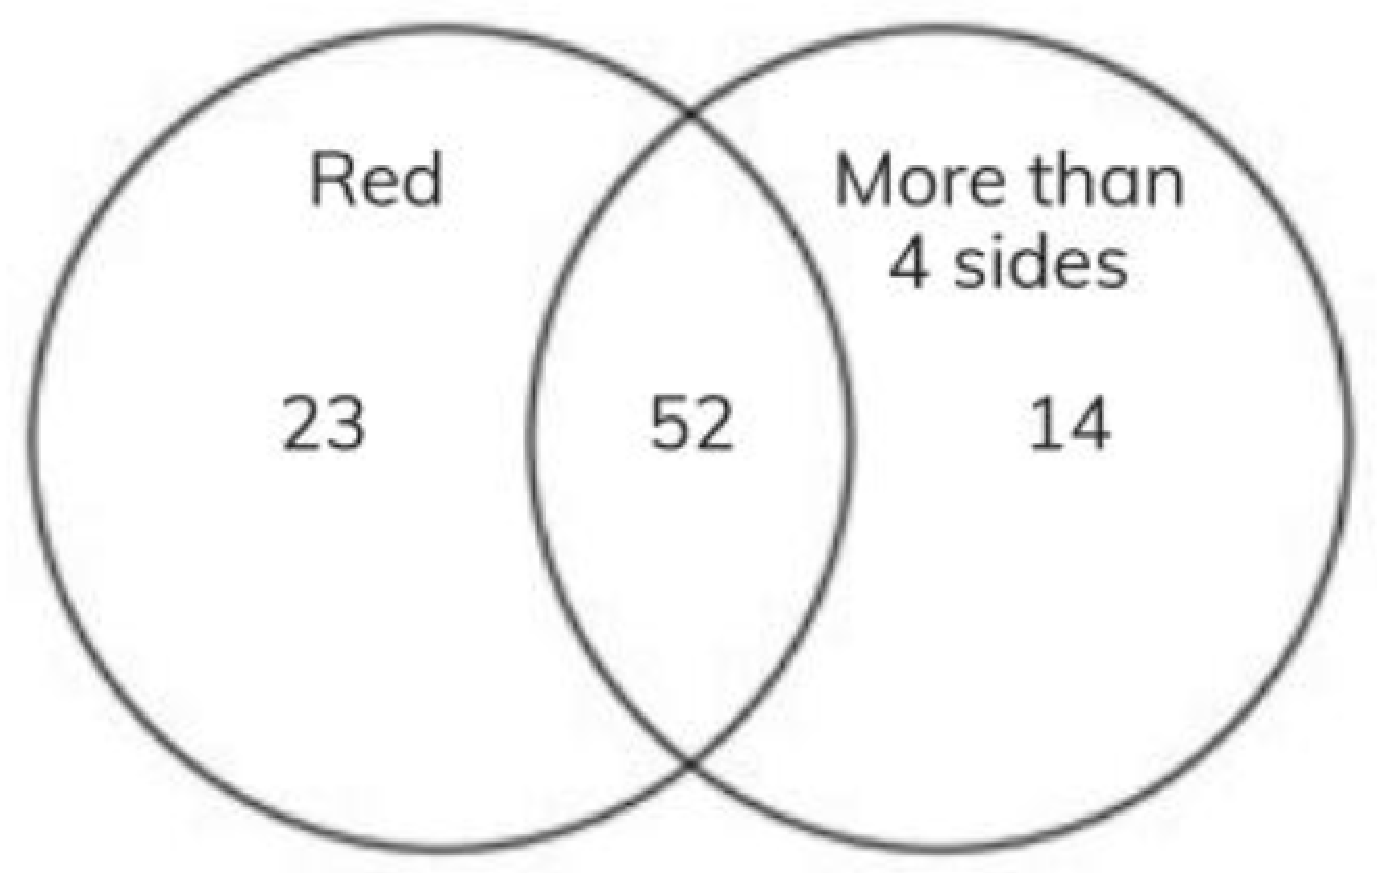
How many shapes are red?
Shapes are sorted into 2 sets.
How many shapes have 4 or fewer sides?
Shapes are sorted into 2 sets.
How many shapes are there altogether?
Shapes are sorted into 2 sets.
Write another question about the data in the Venn diagram. Give it to your partner to answer.
Work as a group of 6 and choose one subject each from the list below.

You will need some paper to write on. Decide on a question to ask the others in your group. Record the answers.
How will you show the data you have got? Explain your choice.
This pictogram shows the cars parked in the car park.
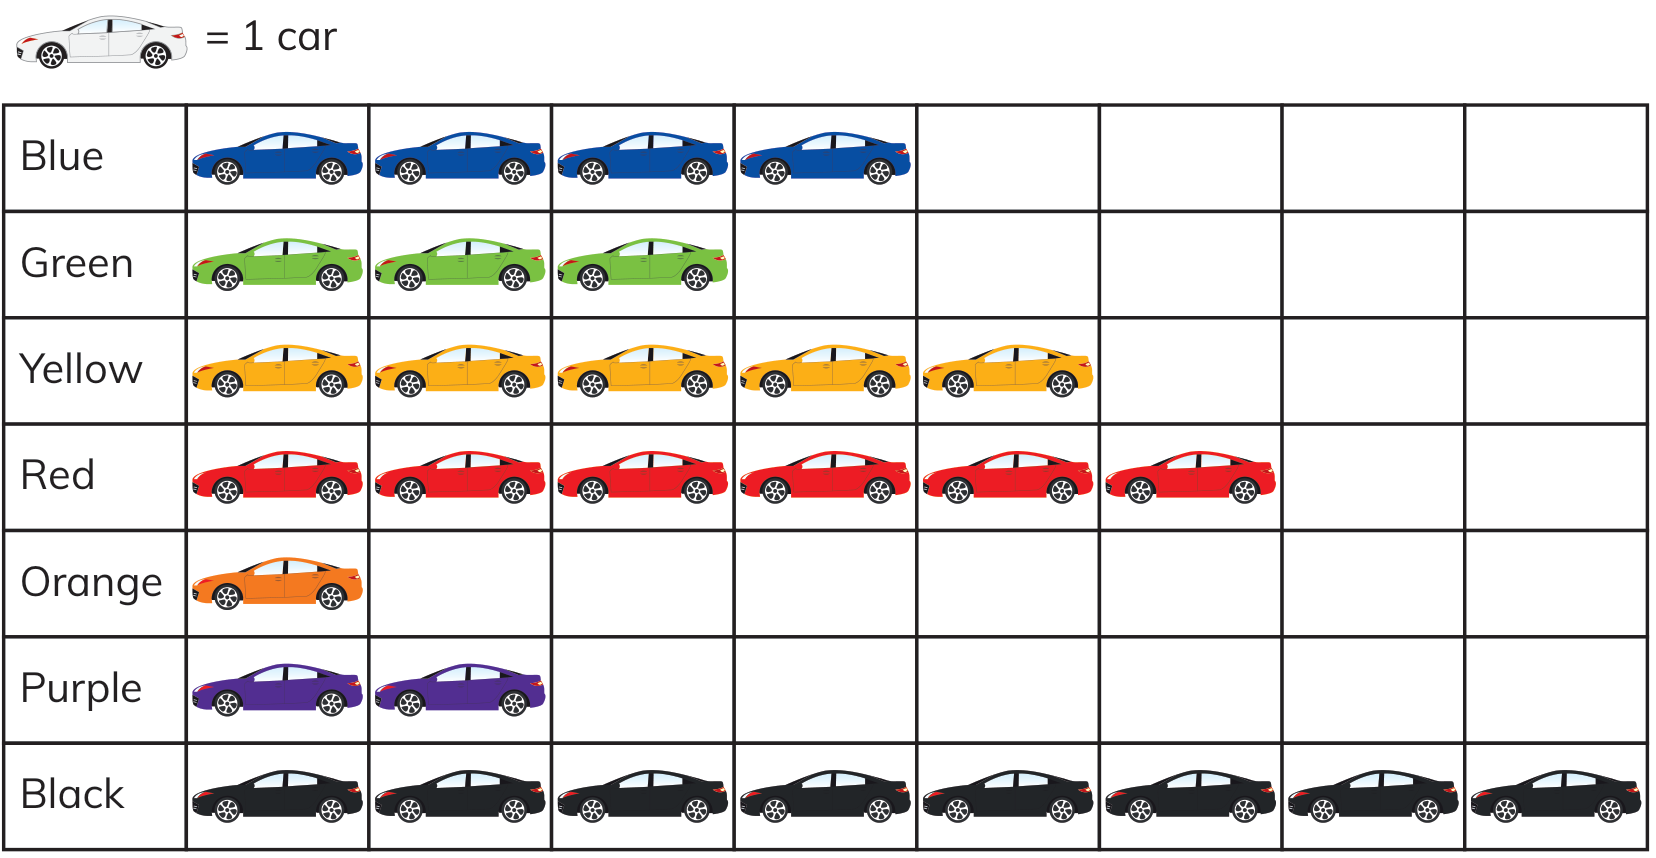
How many black cars are there?
This pictogram shows the cars parked in the car park.
How many red cars are there?
This pictogram shows the cars parked in the car park.
How many yellow cars are there?
This pictogram shows the cars parked in the car park.
How many more red cars than blue cars are there?
This pictogram shows the cars parked in the car park.
How many fewer orange cars than purple cars are there?
This pictogram shows the cars parked in the car park.
How many cars are there altogether?
