Skip to content / Đến nội dung
SachHeCam.com

Unit 4: Statistics

Question 1

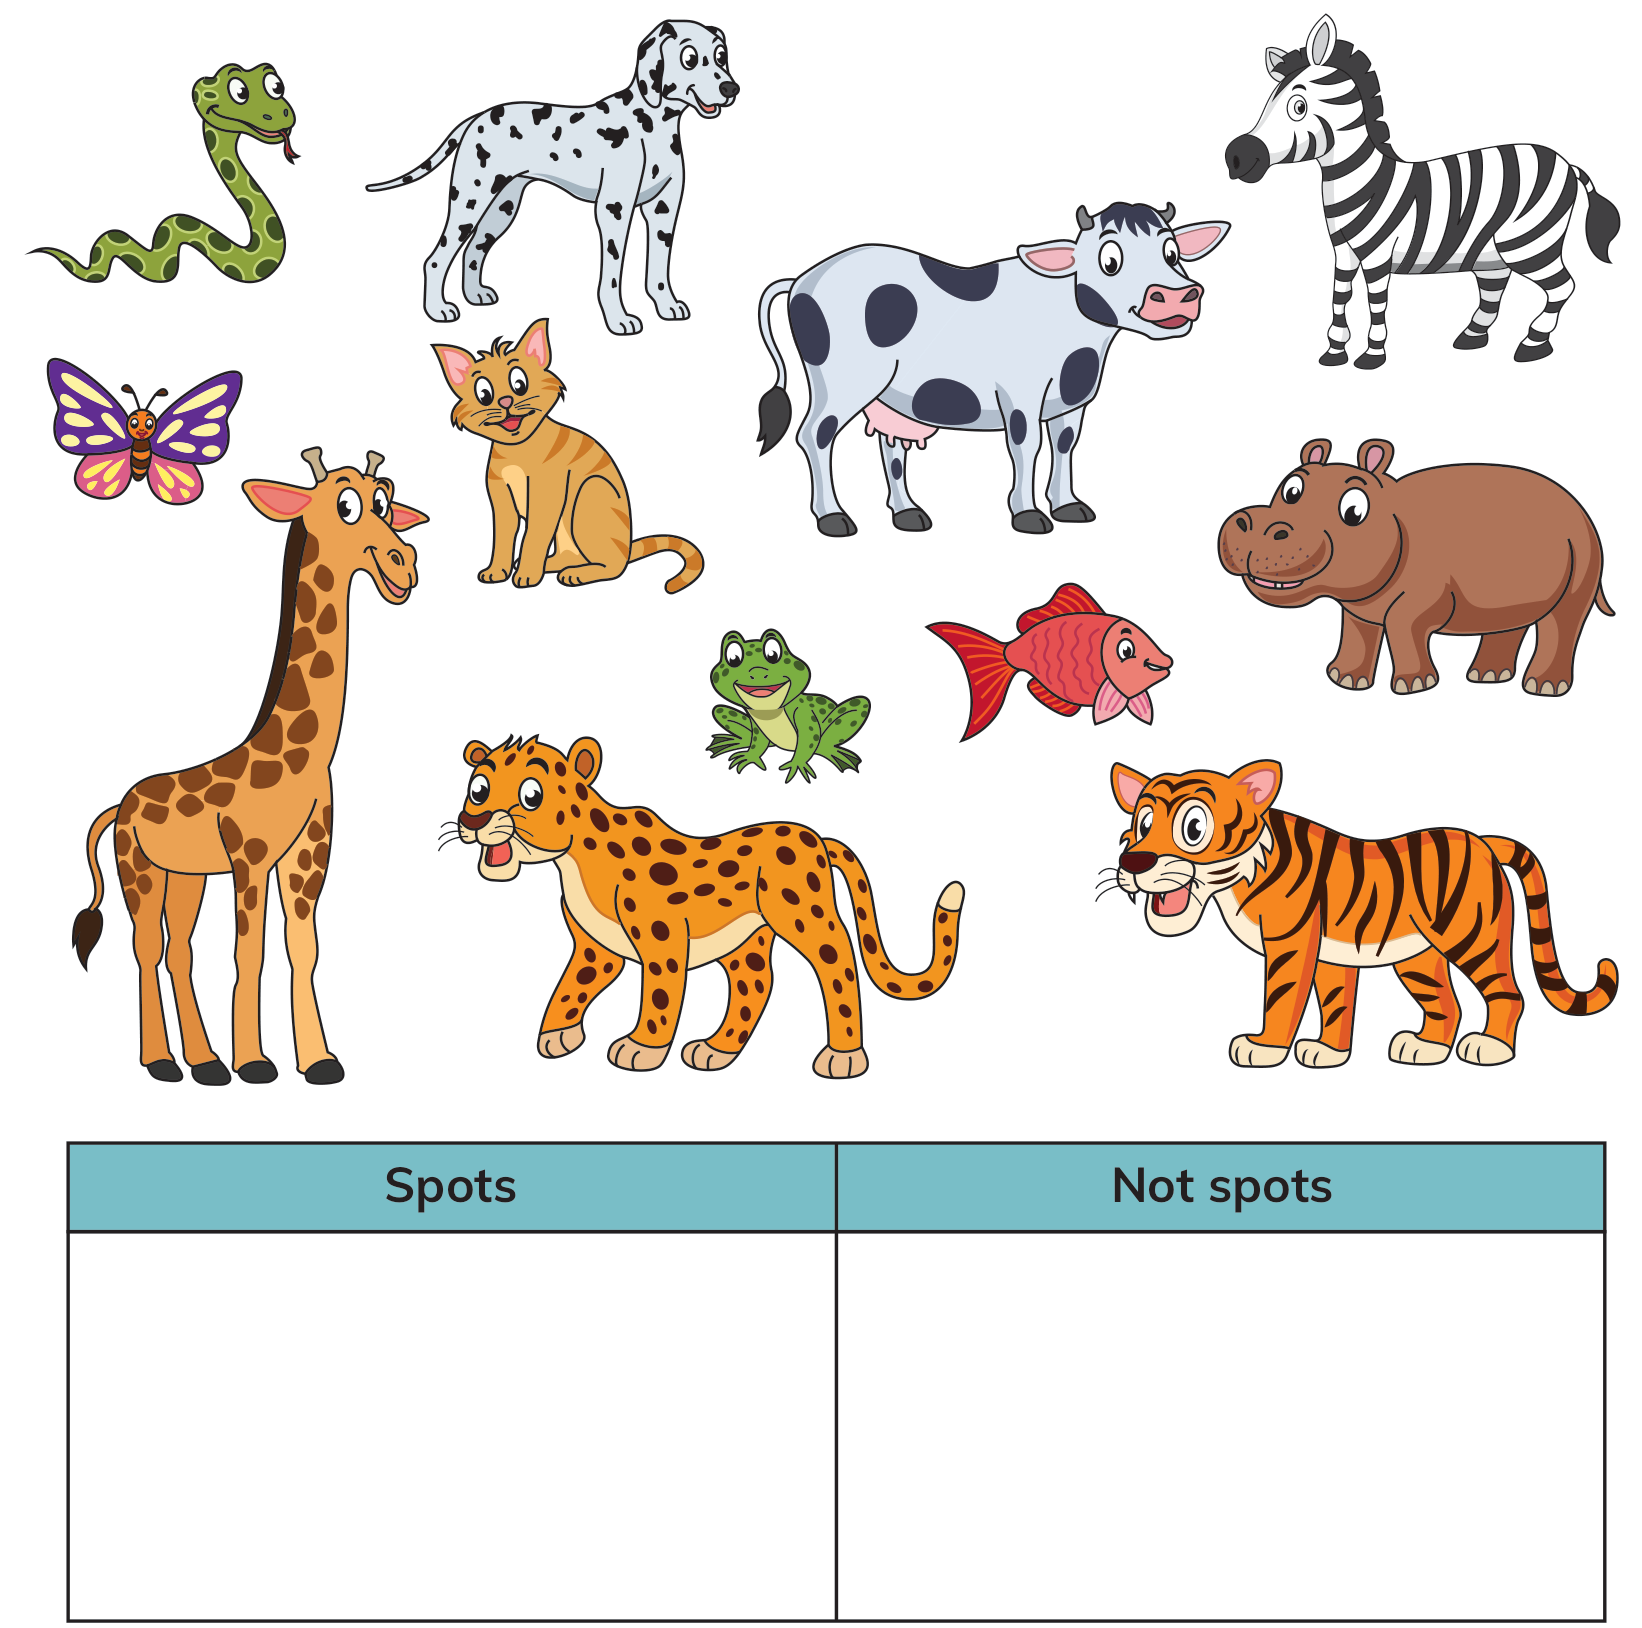
Draw lines to sort the animals into the correct boxes in the Carroll diagram.

Question illustration

Question 2

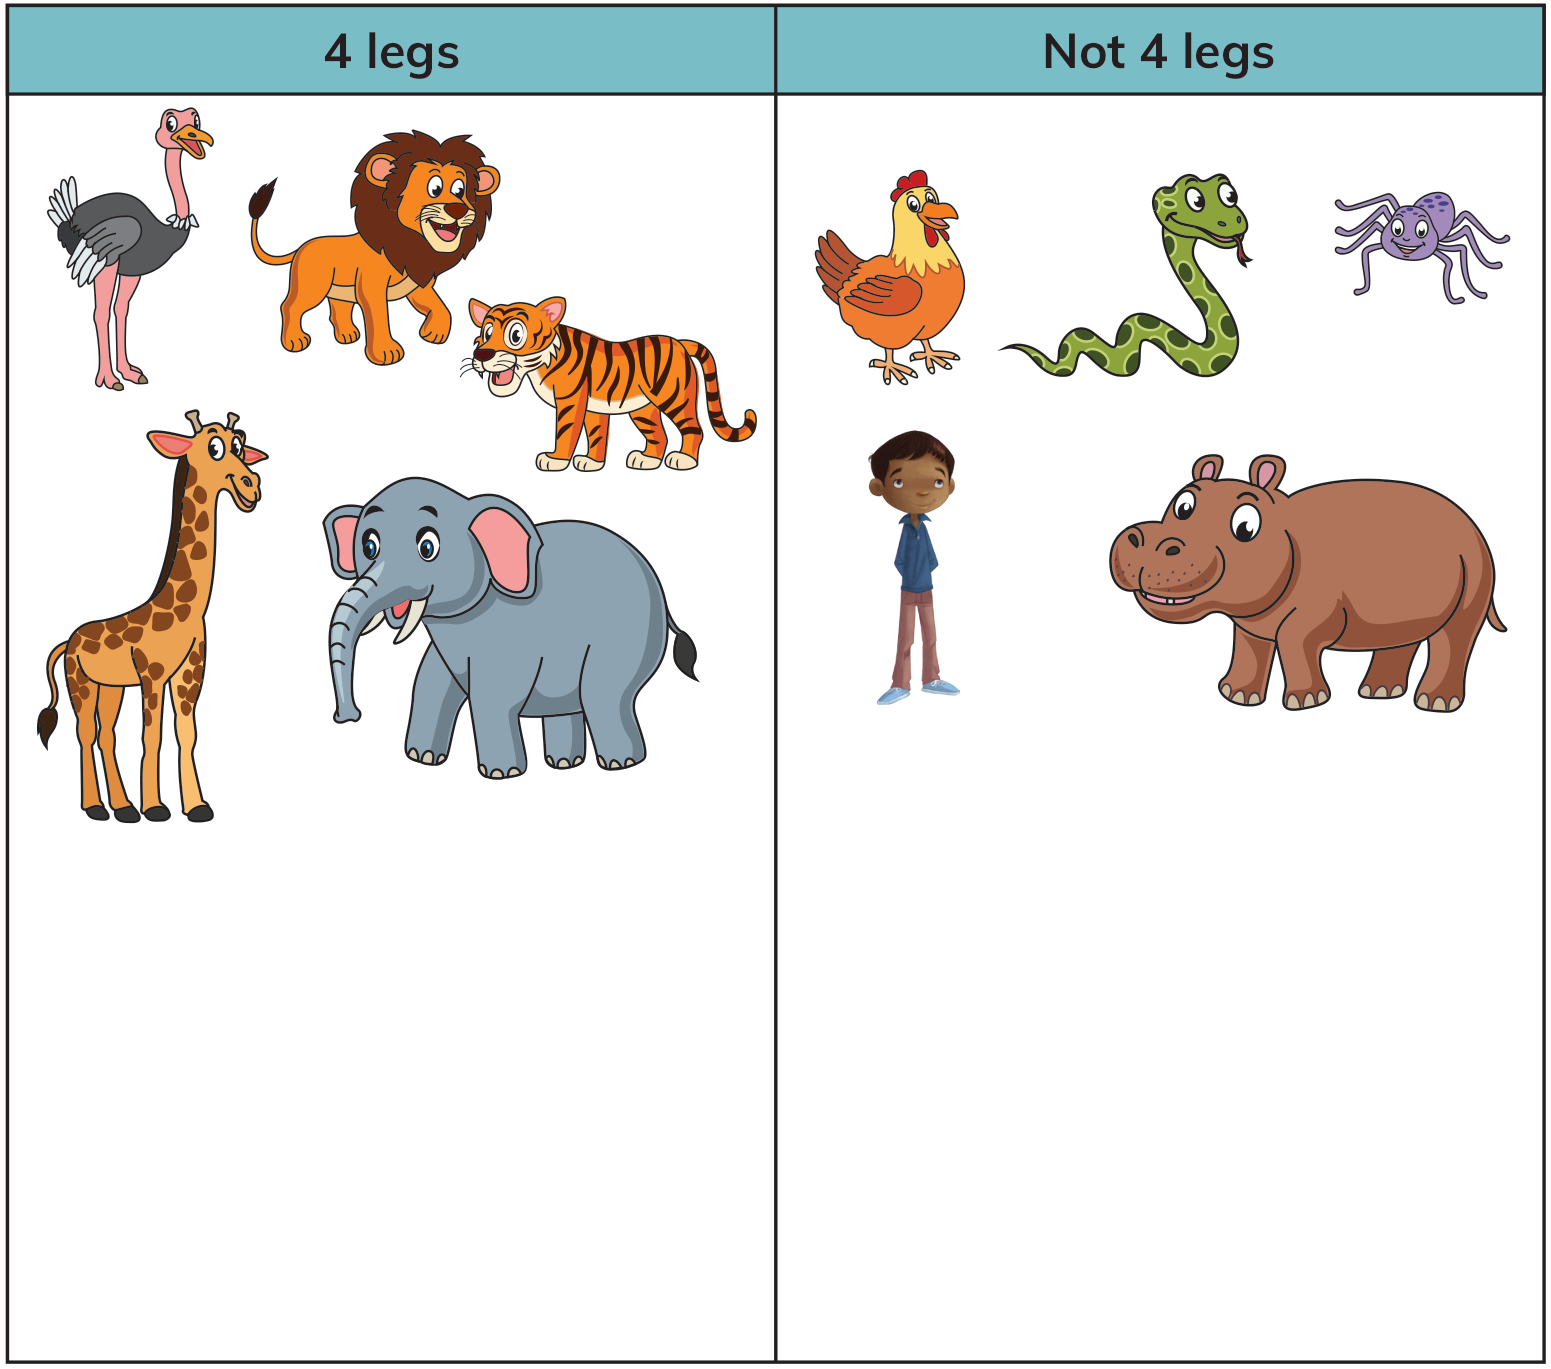
2 animals are in the wrong place in the Carroll diagram. Draw a ring around them.

Question illustration

Draw an animal of your own in each section.

Question 3

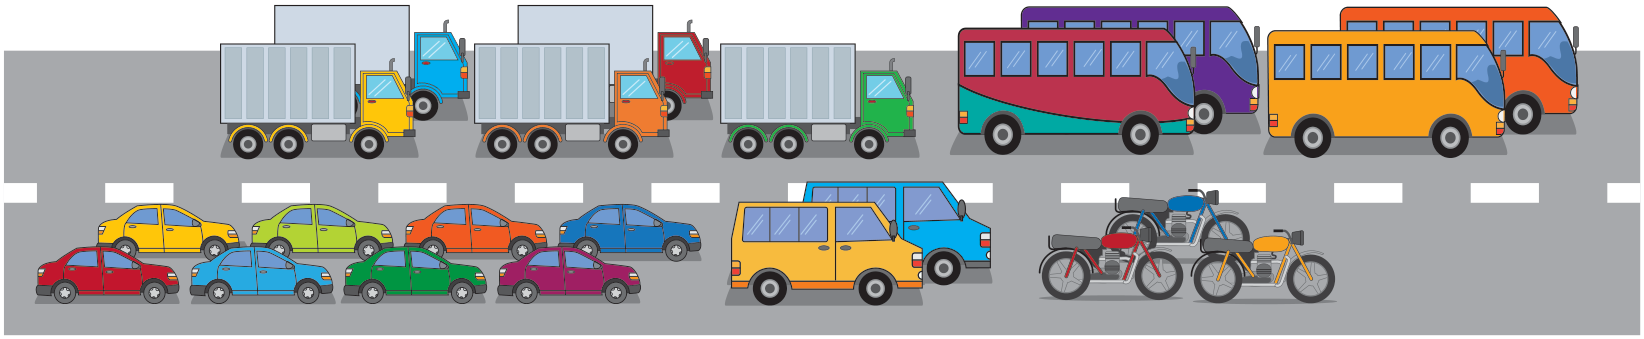
Use tally marks to record how many vehicles there are in this picture.

Question illustration

| Vehicle | Tally |
|:-|:-|
| Cars | |
| Trucks | |
| Vans | |
| Buses | |
| Bikes | |

How many vehicles are there altogether? Show it using tally marks.

Question 4

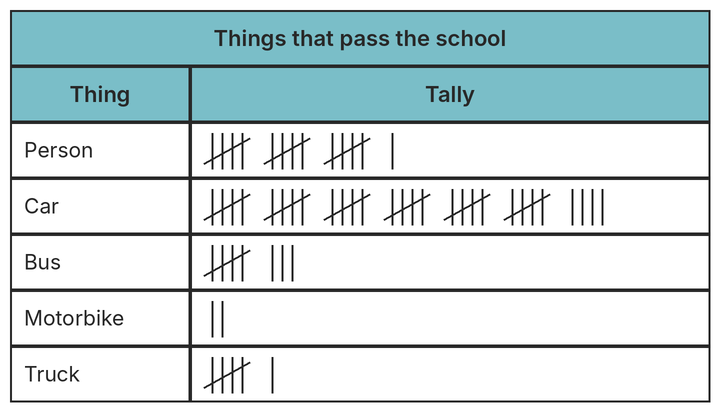
A class made a tally chart of the vehicles and people they saw passing the school in the morning.

Question illustration

How many **people** passed the school?

Question 5

A class made a tally chart of the vehicles and people they saw passing the school in the morning.

Question illustration

How many **cars** passed the school?

Question 6

A class made a tally chart of the vehicles and people they saw passing the school in the morning.

Question illustration

How many **vehicles** passed the school? Show the total number of vehicles that passed as tally marks.

Question 7

A class made a tally chart of the vehicles and people they saw passing the school in the morning.

Question illustration

What if there are double the number of buses and cars? Calculate the total of them. Show it as tally marks.

Question 8

The teacher of a class looked at the snacks her learners brought to school. She made a tally chart of what she saw. Use the tally chart to answer these questions.
Question illustration

How many had fruit?

Question 9

The teacher of a class looked at the snacks her learners brought to school. She made a tally chart of what she saw. Use the tally chart to answer these questions.
Question illustration

How many had cake?

Question 10

The teacher of a class looked at the snacks her learners brought to school. She made a tally chart of what she saw. Use the tally chart to answer these questions.
Question illustration

How many had crisps?

Question 11

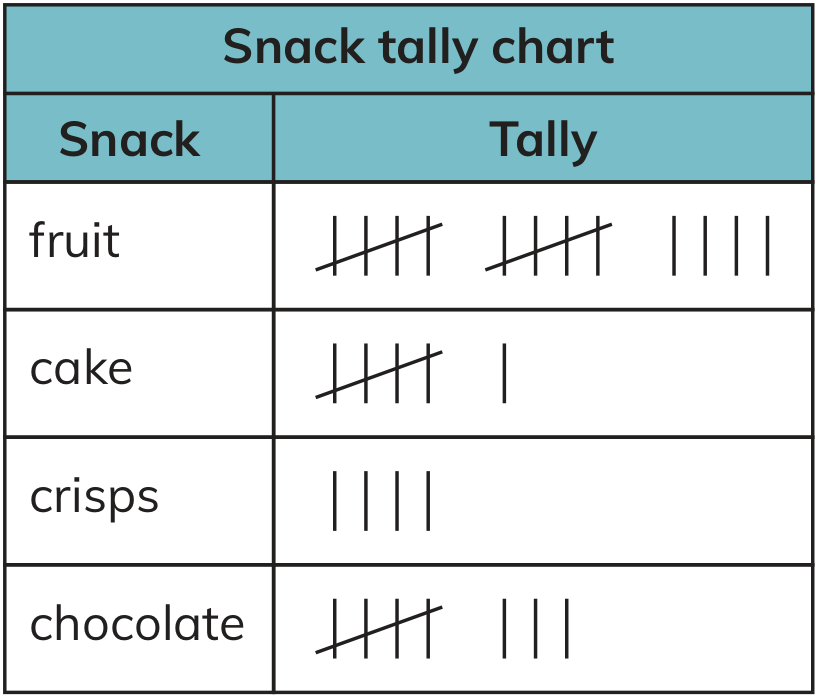
The teacher of a class looked at the snacks her learners brought to school. She made a tally chart of what she saw. Use the tally chart to answer these questions.
Question illustration

How many had chocolate?

Question 12

The teacher of a class looked at the snacks her learners brought to school. She made a tally chart of what she saw. Use the tally chart to answer these questions.

Question illustration

Which snack is most common?
  1. fruit
  2. cake
  3. crisps
  4. chocolate

Question 13

The teacher of a class looked at the snacks her learners brought to school. She made a tally chart of what she saw. Use the tally chart to answer these questions.
Question illustration

Which snack is the least common?
  1. fruit
  2. cake
  3. crisps
  4. chocolate

Question 14

The teacher of a class looked at the snacks her learners brought to school. She made a tally chart of what she saw. Use the tally chart to answer these questions.
Question illustration

How many fewer learners have crisps than fruit?

Question 15

The teacher of a class looked at the snacks her learners brought to school. She made a tally chart of what she saw. Use the tally chart to answer these questions.

Question illustration

How many more learners have chocolate than cake?

Question 16

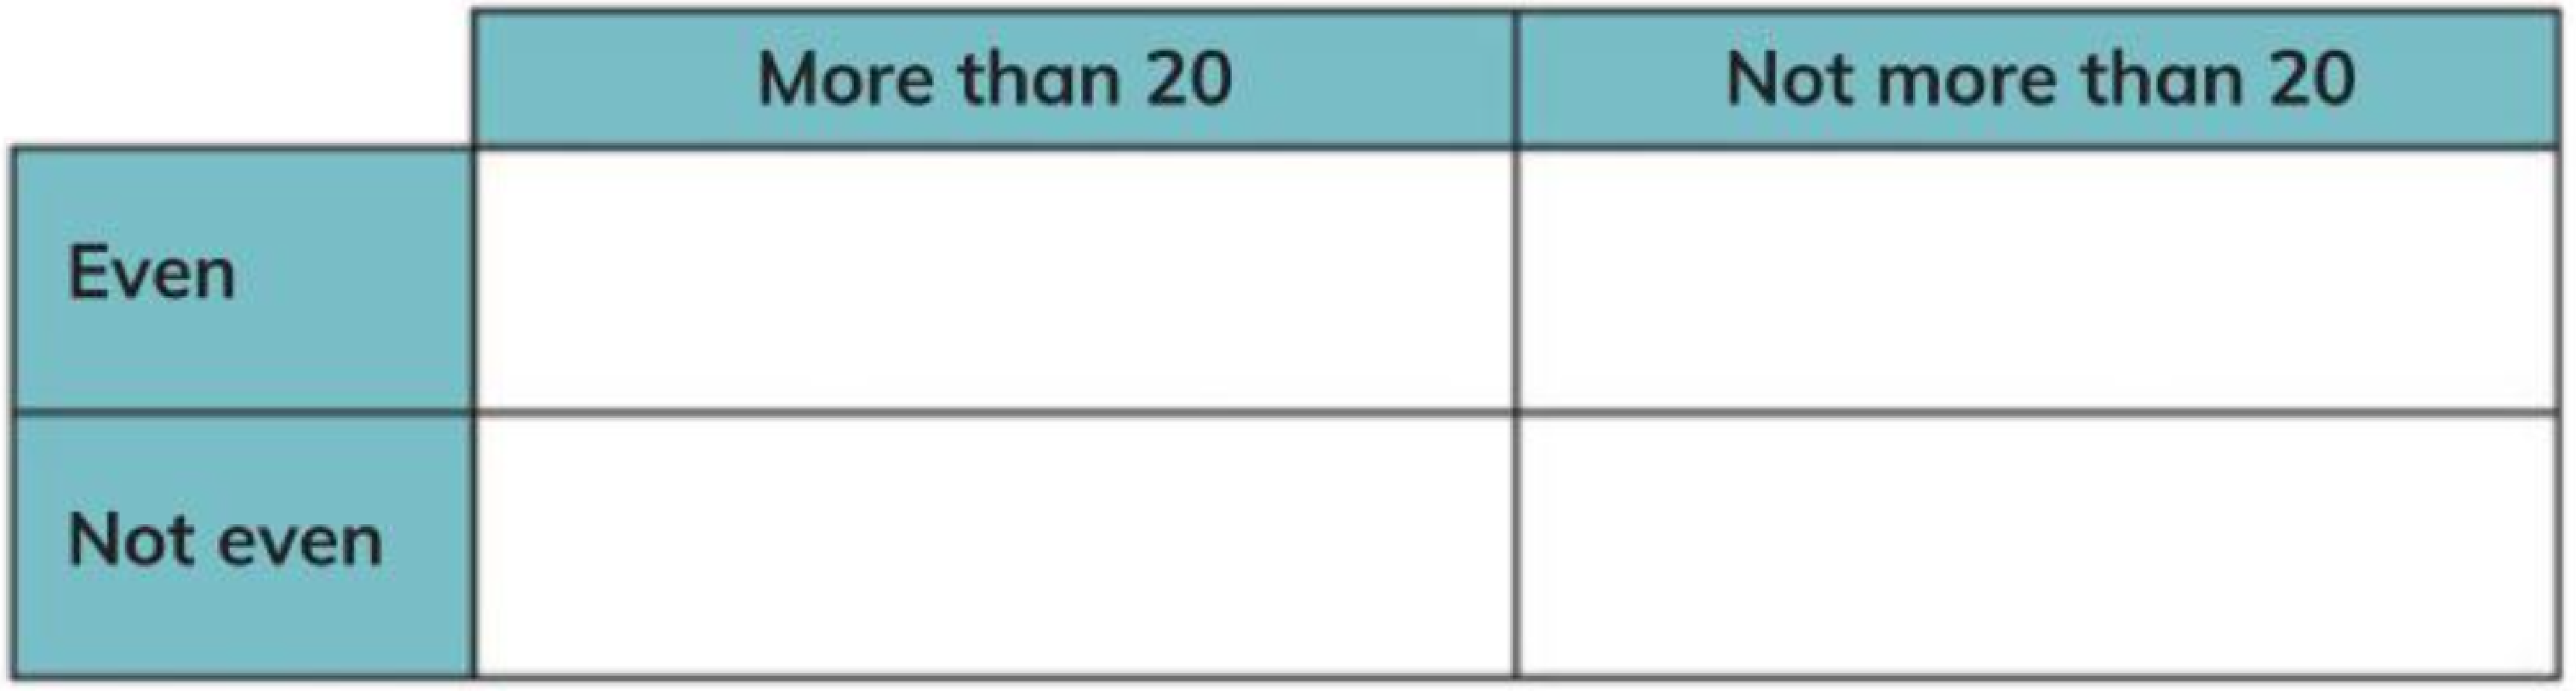
Here is a Carroll diagram. Write the numbers in their correct places on the diagram.

| More than 10 | Not more than 10 |
|:-:|:-:|
| | |

14 3 18 7 2 5 13 20 17 8

4 19 6 11 1 15 12 9 16

Question 17

Choose ten 2-digit numbers less than 50. Write them in the boxes.

Question illustration

Sort your numbers into the Carroll diagram.

Question illustration

Question 18

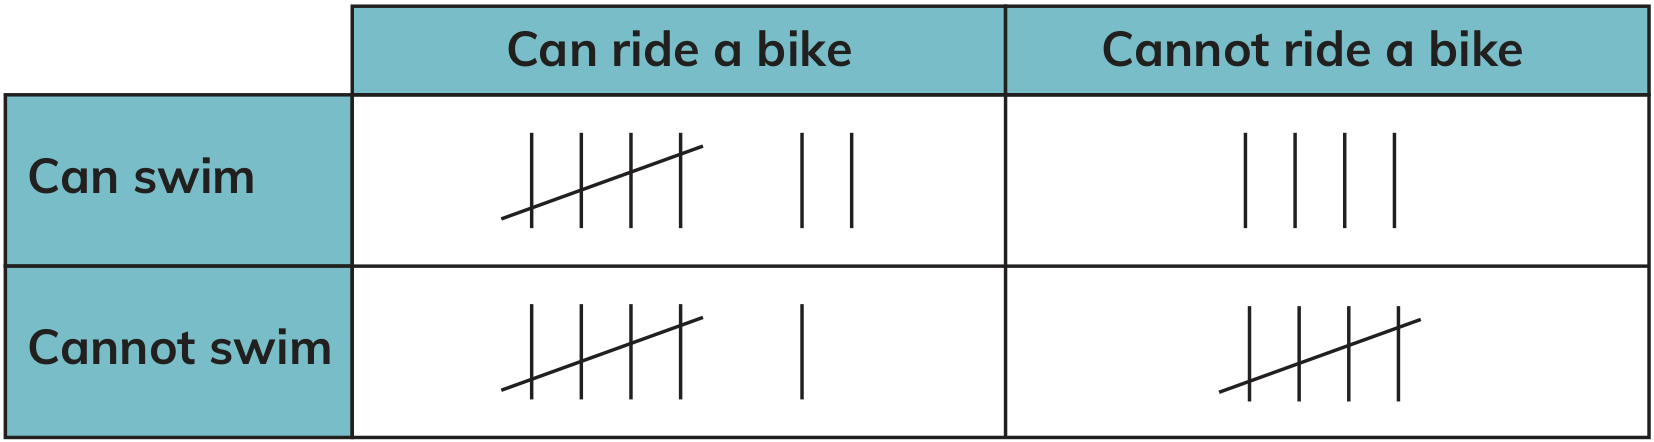
Arun did a survey to see how many of his friends could swim and ride a bike. He showed the results in a Carroll diagram.

Question illustration

Use the diagram to answer this question.

\_\_\_\_ children can swim.

Question 19

Arun did a survey to see how many of his friends could swim and ride a bike. He showed the results in a Carroll diagram.

Question illustration

Use the diagram to answer this question.

\_\_\_\_ children cannot ride a bike.

Question 20

Arun did a survey to see how many of his friends could swim and ride a bike. He showed the results in a Carroll diagram.

Question illustration

Use the diagram to answer this question.

\_\_\_\_ children cannot swim and cannot ride a bike.
0
0
GIỎ HÀNG
Empty CartGIỎ CHƯA CÓ GÌQUAY LẠI SHOP