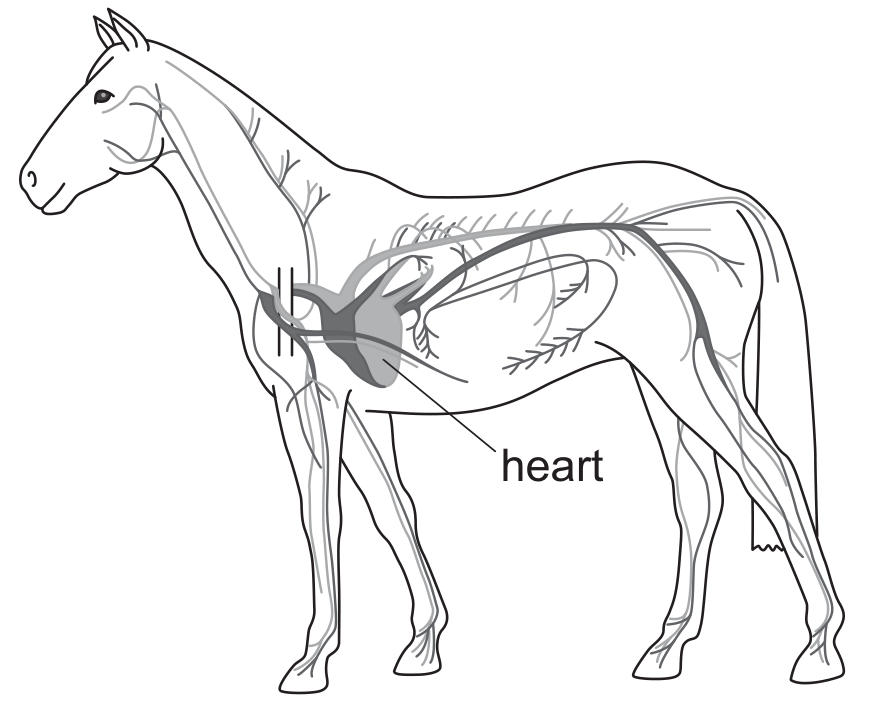
Primary Checkpoint. 2026. Science (0097). March - Paper 2 Next → Look at the diagram of an organ system in a horse.
**(a)** Name this organ system.
Look at the diagram of an organ system in a horse.
**(b)** The diagram of the organ system in a horse is a scientific model.
Write down **one** reason why scientists use models.
Look at the diagram of an organ system in a horse.
**(c)** Yuri records the heart rate of five horses.
| horse | heart rate in beats per minute |
| --- | --- |
| **A** | 35 |
| **B** | 41 |
| **C** | 29 |
| **D** | 32 |
| **E** | 38 |
Calculate the mean heart rate for the five horses.
Show your working.
mean heart rate ______ beats per minute
Look at the diagram of an organ system in a horse.
**(d)** When horses move faster their heart rate increases.
Explain why heart rate needs to increase when horses move faster.
Angelique observes what happens when different solids are mixed with acid.
Angelique observes what happens when different solids are mixed with acid.
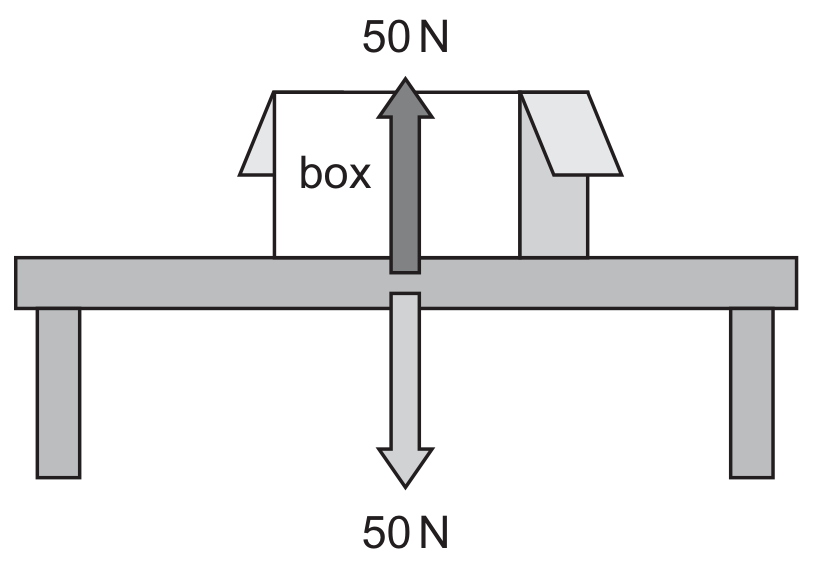
Force diagrams show the size and direction of different forces.
**(a)** A box is on a table.
Describe the effect these **two** forces have on the box.
Force diagrams show the size and direction of different forces.
**(b)** A car is moving along a road.
Describe the effect these **two** forces have on the **moving** car.
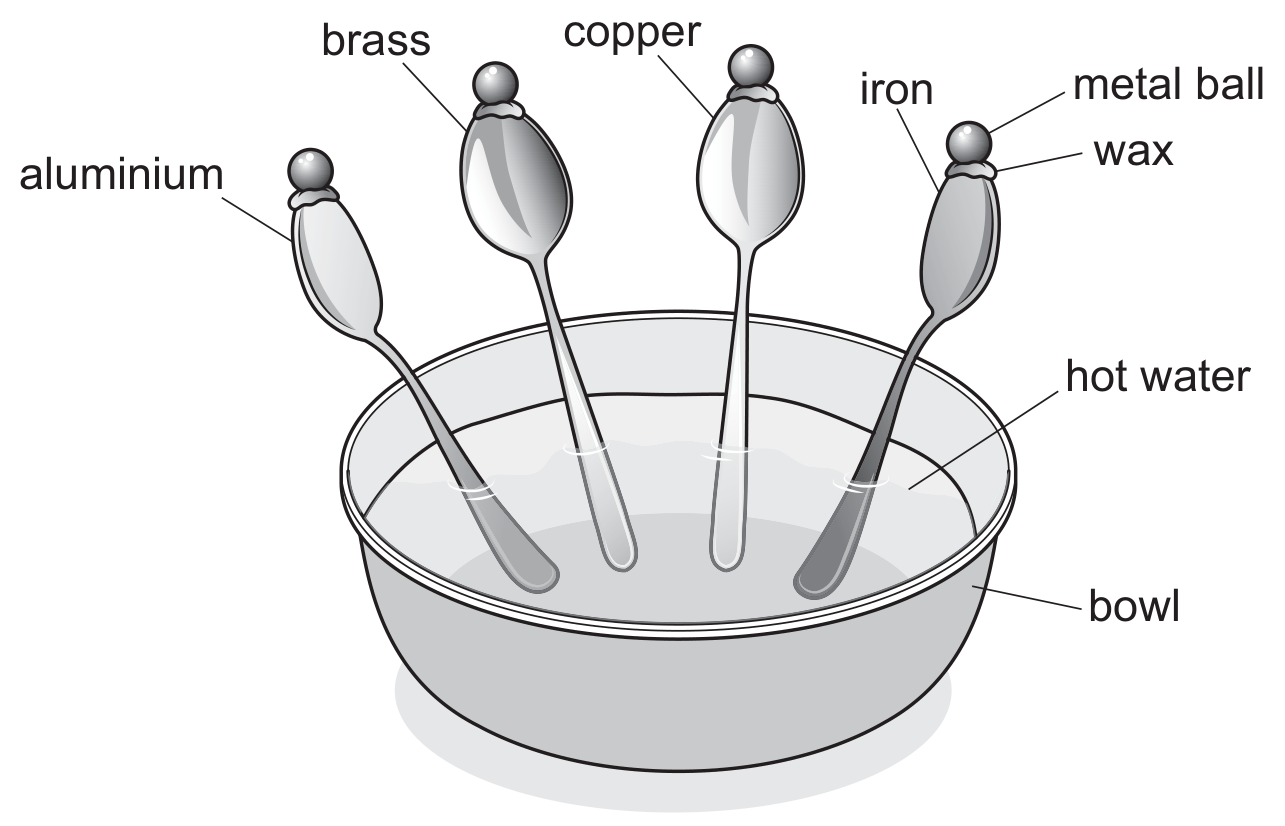
Carlos investigates thermal conductivity.
Look at the diagram of his experiment.
Carlos records the time it takes for each metal ball to fall off each spoon.
**(a)** Write down **two** variables Carlos keeps the same to make his experiment fair.
1 ______
2 ______
Carlos investigates thermal conductivity.
Look at the diagram of his experiment.
Carlos records the time it takes for each metal ball to fall off each spoon.
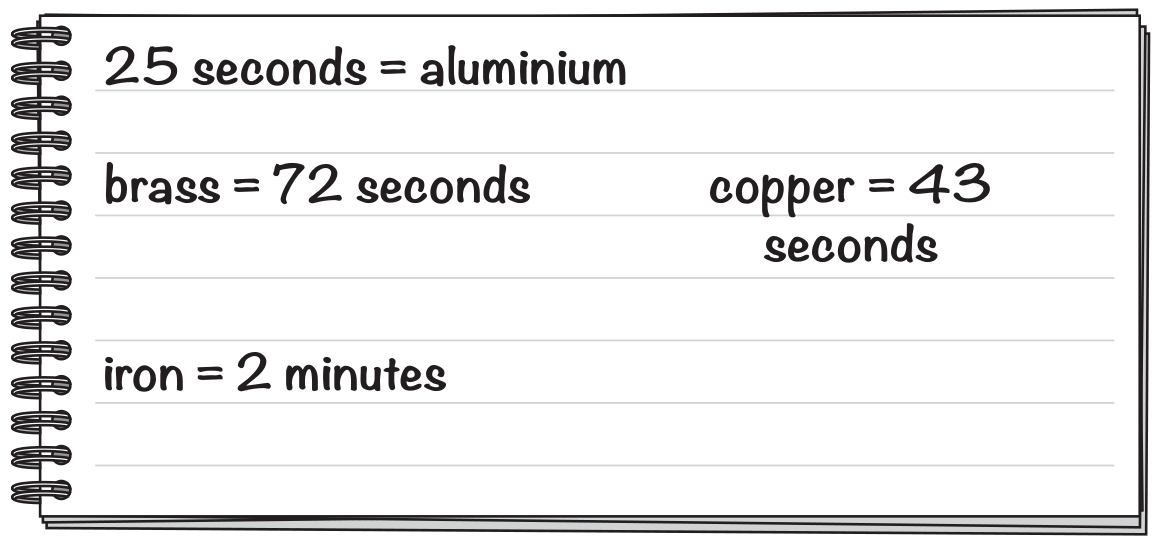
**(b)** Carlos writes his results in a notebook.
Look at his results.
Complete his table of results.
| metal spoon | time taken for the metal ball to drop off the spoon in seconds |
| --- | --- |
| aluminium | ______ |
| brass | ______ |
| copper | ______ |
| iron | ______ |
Carlos investigates thermal conductivity.
Look at the diagram of his experiment.
Carlos records the time it takes for each metal ball to fall off each spoon.
Carlos's results: aluminium 25 s, brass 72 s, copper 43 s, iron 120 s.
**(c)** Circle the best **conclusion** using these results.
all metals are good thermal conductors
all metals are poor thermal conductors
aluminium is the best thermal conductor
brass is the best thermal conductor
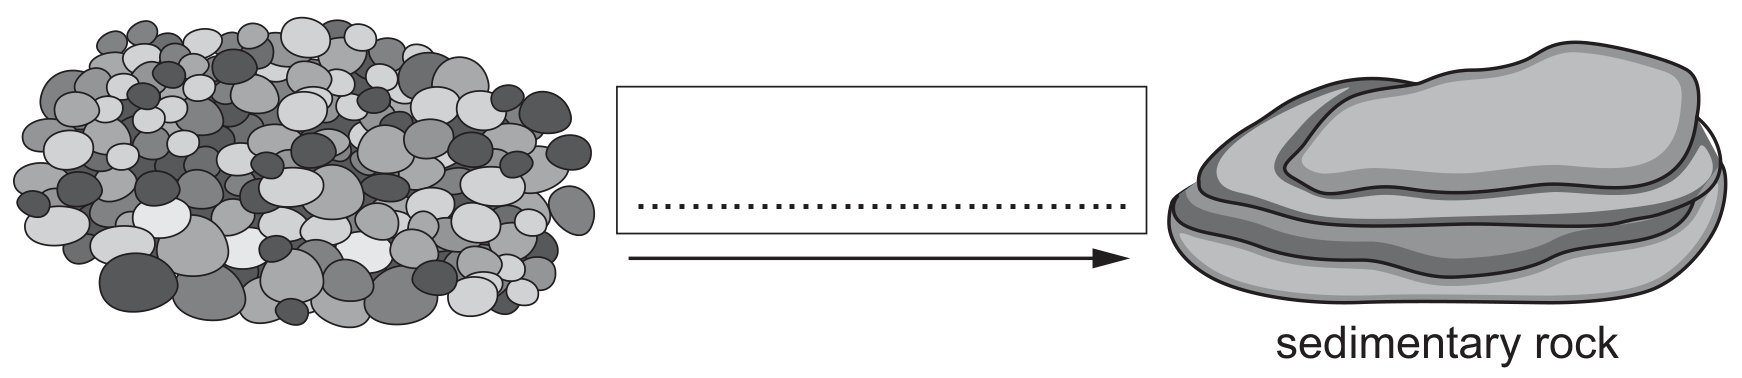
Safia draws part of the rock cycle.
**(a)** Look at the diagram that shows the formation of **sedimentary rock**.
Complete the label on the diagram to name the process that forms sedimentary rock.
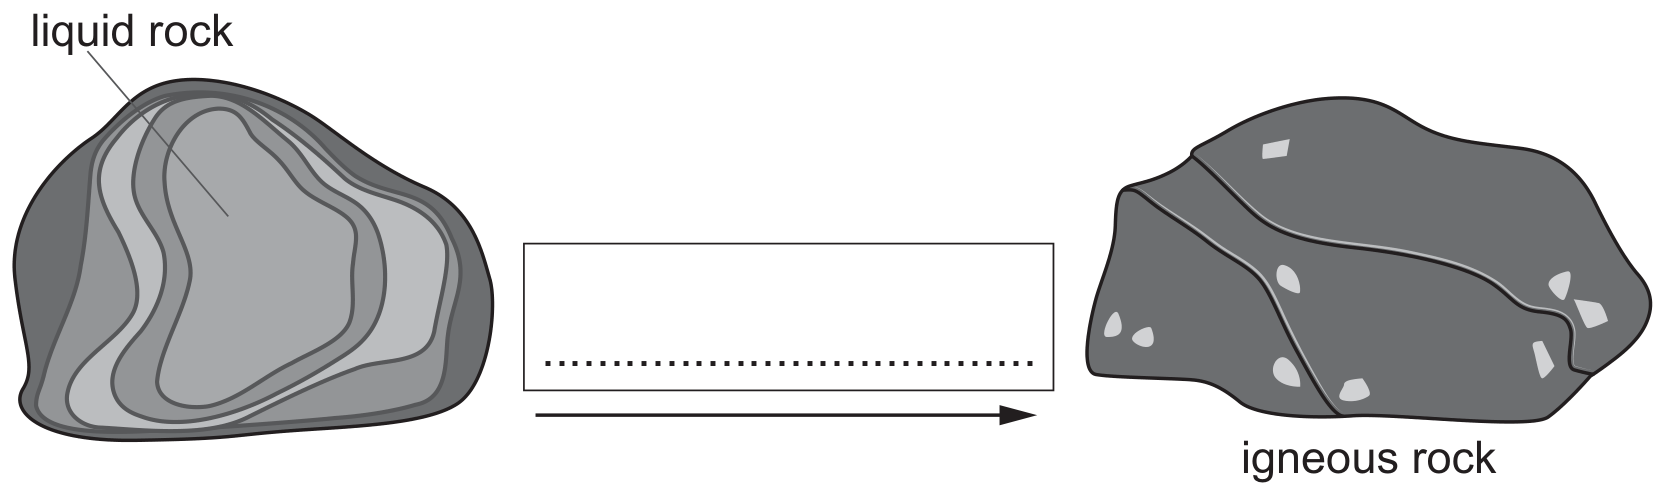
Safia draws part of the rock cycle.
**(b)** Look at the diagram that shows the formation of **igneous rock**.
Complete the label on the diagram to name the process that forms igneous rock.
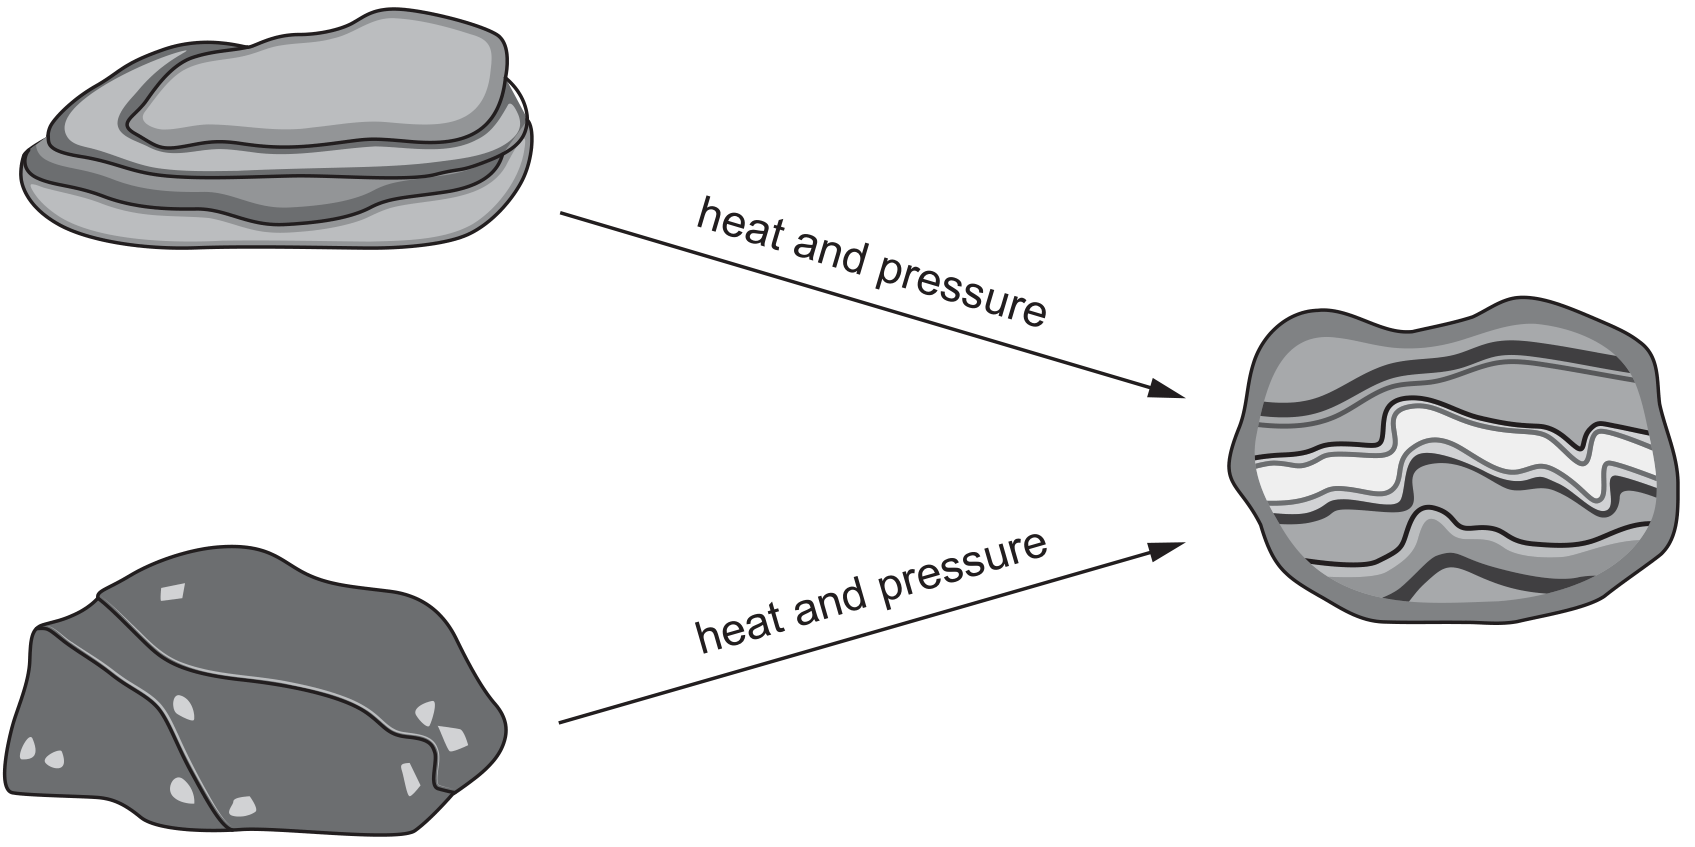
Safia draws part of the rock cycle.
**(c)** Look at the diagram.
Write down the type of rock being formed in the diagram.
Changes happen during puberty in humans.
Changes happen during puberty in humans.
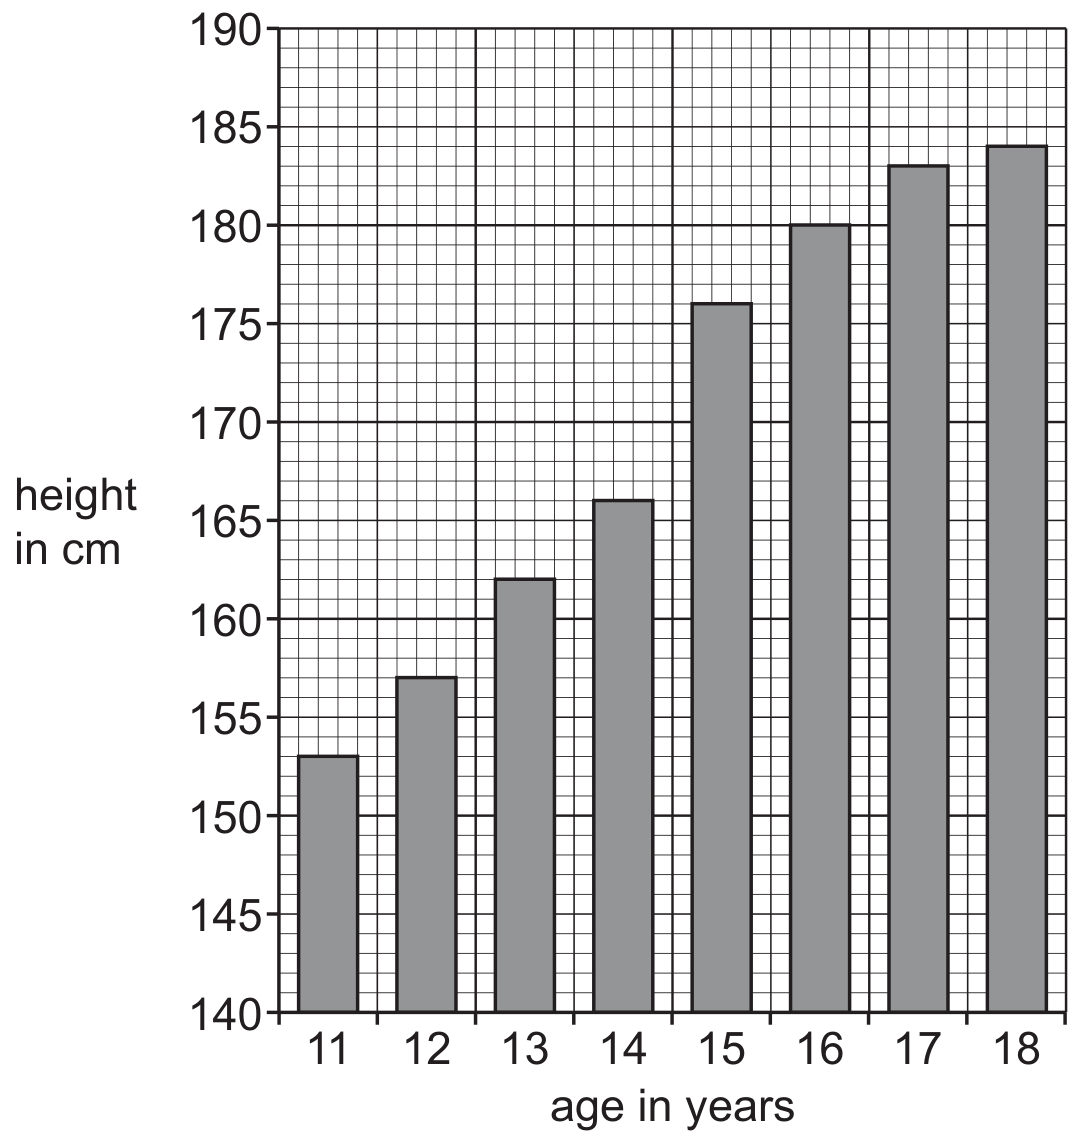
**(b)** During puberty, the height of girls and boys increases rapidly.
The graph shows the height of a boy from 11 to 18 years of age.
When does the height of the boy increase most rapidly?
Circle the correct answer.
from 11 years to 12 years
from 12 years to 13 years
from 14 years to 15 years
from 16 years to 17 years
Priya collects information about the phases of the Moon.
Priya collects information about the phases of the Moon.
| date | percentage % of Moon visible |
| --- | --- |
| 27 April | 50 |
| 4 May | 0 |
| 11 May | 50 |
| 19 May | 100 |
| 27 May | 50 |
| 3 June | 0 |
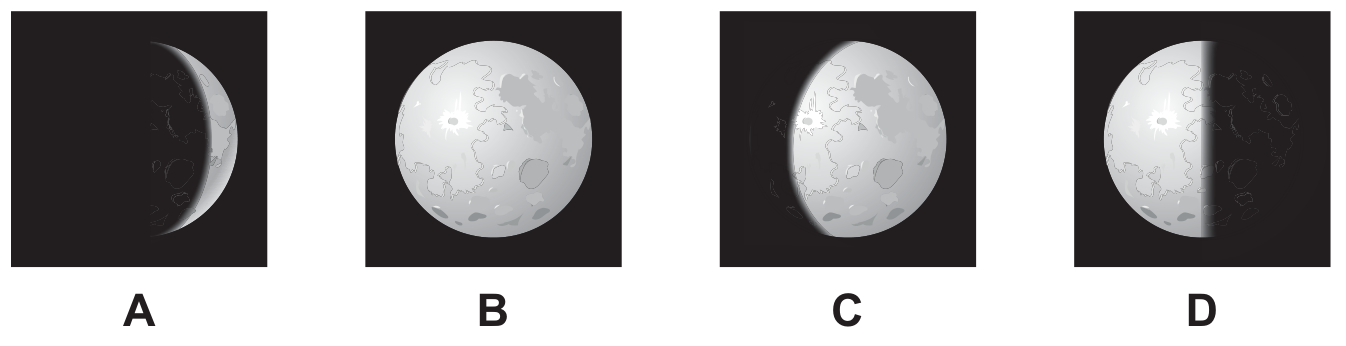
**(b)** Look at the diagrams.
Which letter shows the phase of the Moon on 27 May?
A
B
C
D
Priya collects information about the phases of the Moon.
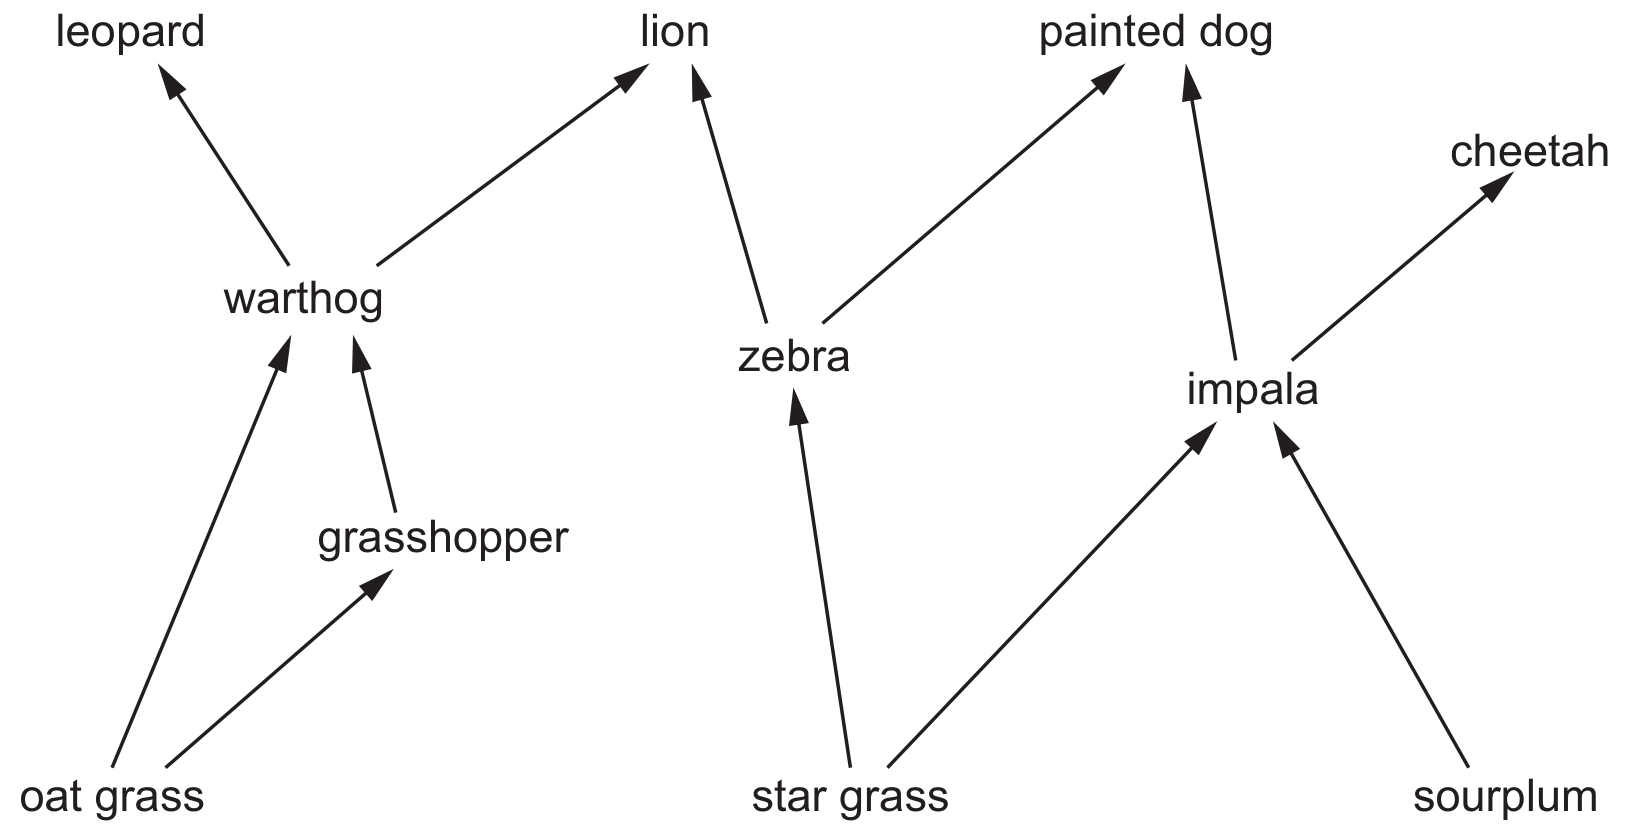
The diagram shows a food web in a grassland habitat.
**(a)** Write down **one** complete food chain from this food web that contains the warthog.
Next →