Question 12
Irfan enjoys horse riding. Early one morning, he rode a horse through the woods. The horse trots for 18 minutes and covers a distance of 4 km. It then speeds up to a canter and covers 7 km in 10 minutes. Irfan takes a 20-minute break to rest and enjoy the scenery. Finally, he sets off again and the horse gallops back home, covering 6 km in 6 minutes.
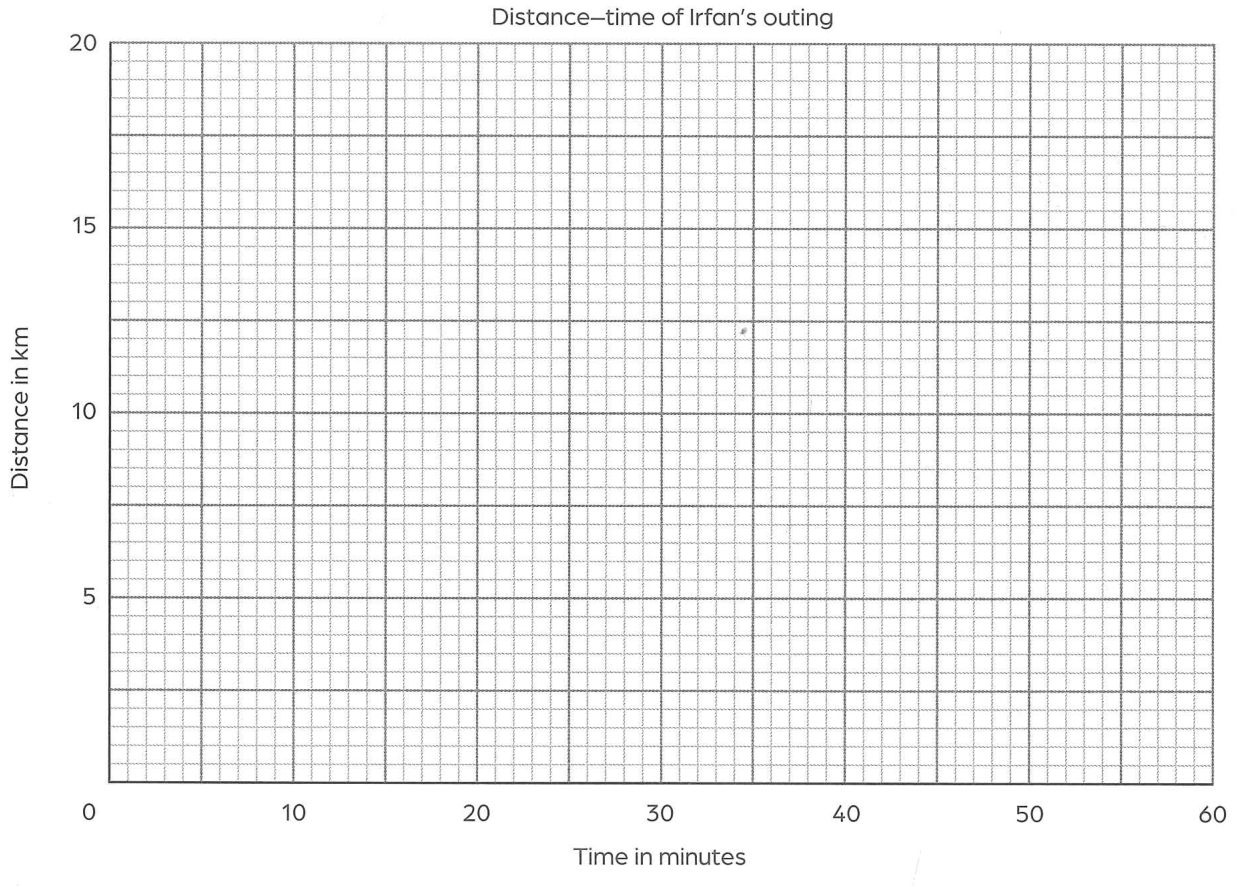
Use the data in the table to plot a distance–time graph of Irfan’s outing.
|Total time (minutes)|Total distance travelled (km)|
|---|---|
|0|0|
|18|4|
|28|11|
|48|11|
|54|17|
Use the data in the table to plot a distance–time graph of Irfan’s outing.
|Total time (minutes)|Total distance travelled (km)|
|---|---|
|0|0|
|18|4|
|28|11|
|48|11|
|54|17|
