Question 33
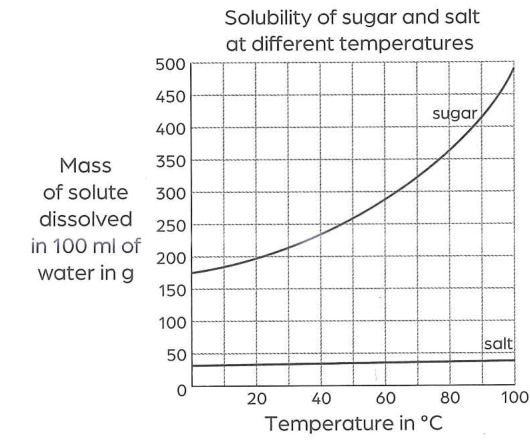
The graph shows how much sugar and salt dissolve at different temperatures.
The graph shows that temperature affects the dissolving of sugar more than it affects the dissolving of salt. Explain how the graph shows this.
The graph shows that temperature affects the dissolving of sugar more than it affects the dissolving of salt. Explain how the graph shows this.
