Question 22
Compare the data in Figure 12.6A and 12.6B.
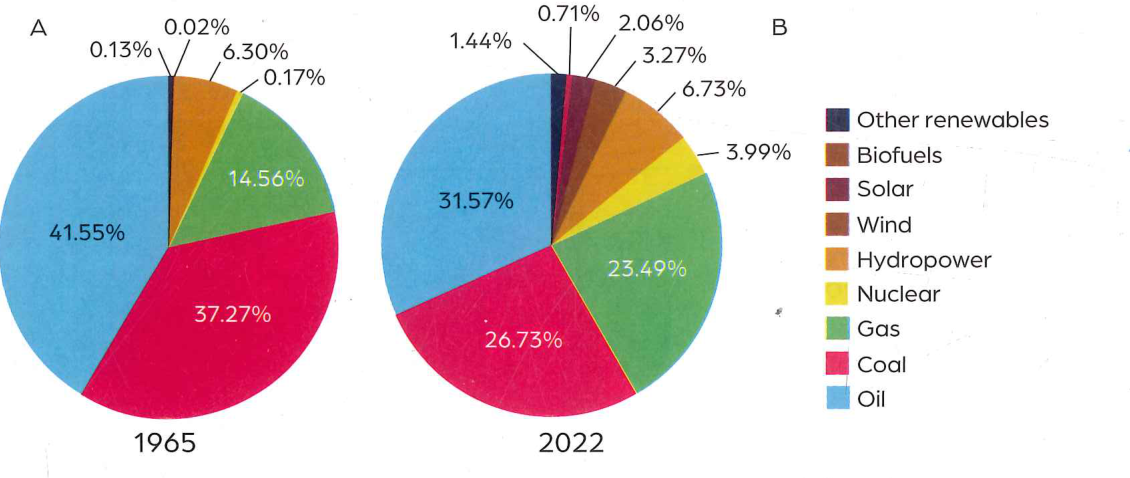
Discuss the similarities and differences between the two pie charts. Give reasons for the differences between them.
Discuss the similarities and differences between the two pie charts. Give reasons for the differences between them.
